


 Faces Pressure at Key Support Level Amid Tightening Volatility")


TLDR
- HBAR trades near $0.21 with the market cap at $9.05B, facing key support.
- A break below $0.21 could lead to deeper losses for Hedera (HBAR).
- The 20-day SMA at $0.23 is crucial for Hedera’s potential recovery.
- Chaikin Money Flow indicator shows weak capital inflows for HBAR.
Hedera (HBAR) is currently testing crucial support near the $0.21 mark, as volatility narrows and market uncertainty rises. While the price sits at the lower Bollinger Band, signs of potential recovery are emerging if buyers return to the market. However, a sustained break below this level could signal further bearish action. Traders are monitoring key resistance levels and broader market trends to gauge whether HBAR can regain upward momentum or face deeper declines.
Price Action: Struggling at Support
At $0.21, Hedera is grappling with selling pressure, marking a critical test for the cryptocurrency. Trading close to the lower Bollinger Band suggests that the asset might be oversold, presenting a potential opportunity for a corrective bounce if buyers re-enter the market. However, continued downward movement remains a possibility, particularly if selling pressure persists.
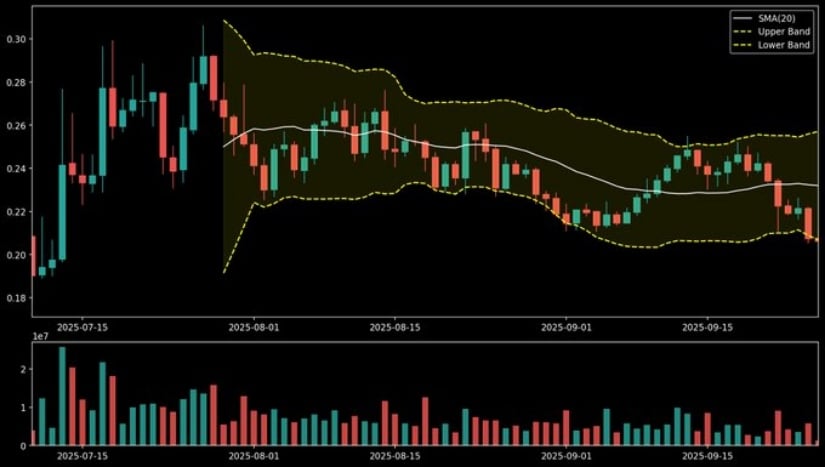
The immediate resistance for HBAR stands at $0.23, which aligns with the 20-day simple moving average (SMA) and the middle Bollinger Band. Reclaiming this level could signal a shift in momentum and set the stage for a potential rally. Without breaking through this barrier, the outlook remains cautious, with the price likely to remain range-bound or continue its downward trajectory.
Market Capitalization Trends and Support Levels
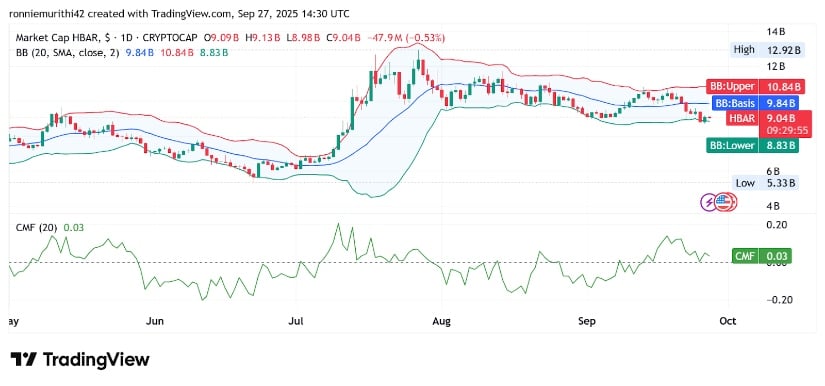
As of the latest data, Hedera’s market capitalization stands at approximately $9.05 billion. This figure remains under pressure, as the token hovers near the lower Bollinger Band for market cap at $8.83 billion. If this support level is broken, further bearish continuation could unfold, with potential testing of deeper support zones. Conversely, reclaiming the middle Bollinger Band at $9.84 billion could signal that the market is stabilizing, and a reversal could be on the horizon.
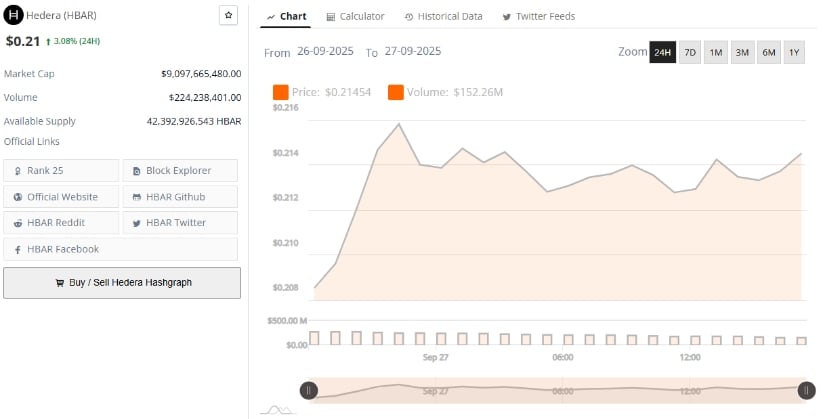
A sustained move beyond the upper Bollinger Band near $10.84 billion would confirm a bullish shift in the market sentiment. Until then, the market cap remains under a bearish influence, reflecting cautious investor sentiment. With trading volume at $224.2 million, liquidity appears healthy, but the price remains under pressure.

Chaikin Money Flow Shows Modest Capital Inflows
The Chaikin Money Flow (CMF) indicator for HBAR is currently reading at 0.03, reflecting minimal capital inflows. Although this is a positive sign, it does not yet signal strong buyer conviction. A move into the 0.1–0.2 range would provide more confidence that buyers are stepping in. However, if the CMF dips back into negative territory, it could signal renewed selling pressure, reinforcing the bearish trend.
The slight positive reading indicates that, despite the prevailing bearish sentiment, there is still some level of buyer activity. The market’s reaction in the coming days will likely determine whether this mild positive shift can evolve into a stronger buying trend or if the selling pressure will dominate and push HBAR lower.
Outlook: Key Levels to Watch
Hedera’s near-term outlook depends largely on its ability to hold key support at $0.21 and reclaim resistance at $0.23. A move above the middle Bollinger Band would suggest a possible reversal, but a break below the current support could lead to further downside risks.
Investors will be closely monitoring market conditions and key indicators to assess whether Hedera can navigate this tight volatility range and set the stage for a potential recovery. With tightening volatility, traders are preparing for a potentially significant directional move in the coming days.


