


 Price: Analysts See 2020 Pattern Repeating Despite Market Weakness")


TLDR
- Cardano (ADA) dropped nearly 6% on Tuesday and continues trading below $0.82 on Wednesday as bearish pressure increases
- Hashdex confirmed it will add ADA to its Nasdaq Crypto Index U.S. ETF, bringing institutional credibility and potential liquidity
- The Cardano Foundation’s 2025 roadmap includes a massive DeFi liquidity fund, $10M real-world asset project, and 12% marketing budget increase
- On-chain data shows negative Spot Taker CVD and a long-to-short ratio of 0.89, indicating more traders are betting on price declines
- Analysts point to a repeating macro pattern similar to 2020-2021, when ADA rallied from $0.05 to $3.10, with potential targets at $2.77, $3.29, and $3.74
Cardano is experiencing a correction phase this week. The cryptocurrency fell nearly 6% on Tuesday and remains under pressure on Wednesday, trading below $0.82.
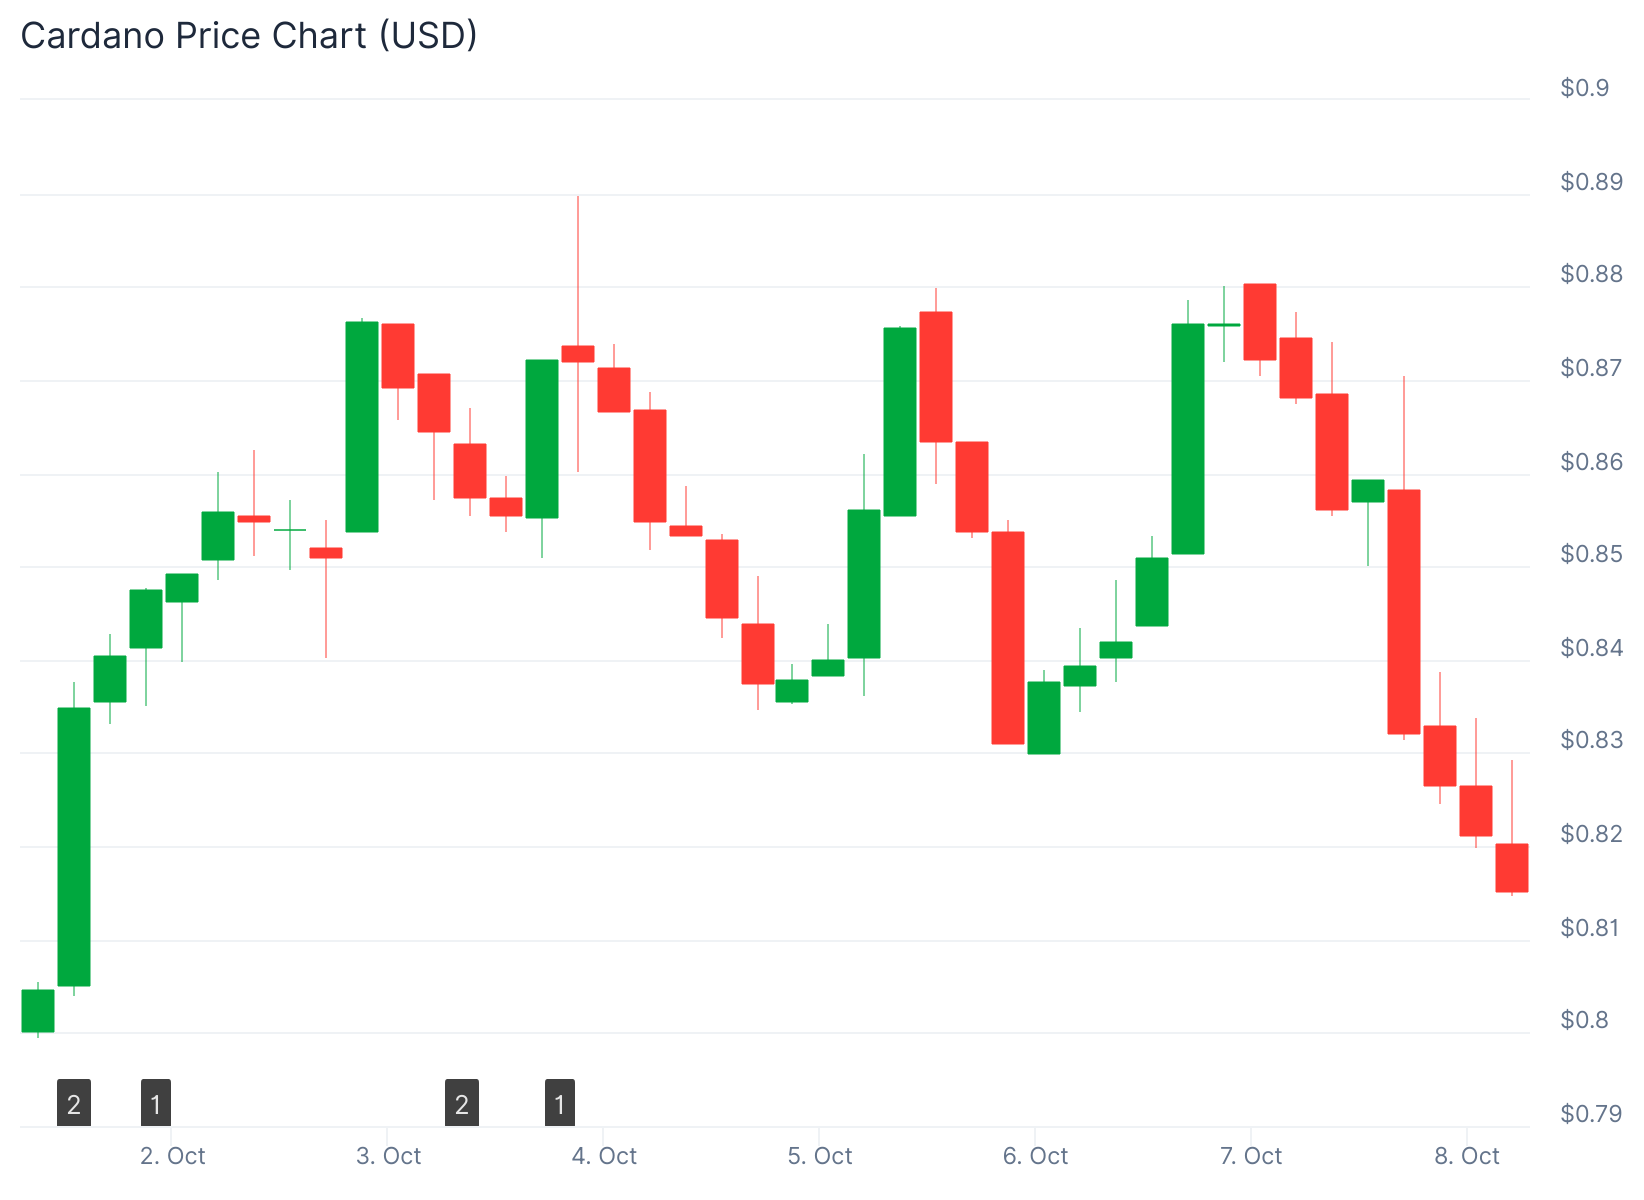
The immediate price action looks bearish. ADA failed to hold support at the $0.84 level and dropped below the 61.8% Fibonacci retracement at $0.82.
On-chain data confirms the selling pressure. CryptoQuant’s Spot Taker CVD for Cardano shows negative values that have been rising since mid-July. This metric tracks the difference between market buy and sell volumes over three months.
%20(2)-1759899301831-1759899301833.png&w=1536&q=95)
A negative reading indicates a Taker Sell Dominant Phase. This means more aggressive selling than buying is happening in the market right now.
The derivatives market tells a similar story. CoinGlass reports that ADA’s long-to-short ratio stands at 0.89, near its monthly high. When this ratio sits below one, it shows bearish sentiment.
More traders are placing bets that the price will fall rather than rise. This adds to the near-term pressure on ADA.
Technical indicators support the correction narrative. The Relative Strength Index on the daily chart reads 45, below the neutral level of 50. The Moving Average Convergence Divergence lines are close to flipping a bearish crossover.

If ADA continues declining, the next support level sits at the 200-day Exponential Moving Average around $0.76. This represents another 6% drop from current levels.
Institutional Interest Builds
Despite short-term weakness, institutional developments are emerging. Hashdex announced it will add ADA to its Nasdaq Crypto Index U.S. ETF.
🚨 S&P launches top 10 Crypto Index with $ADA. pic.twitter.com/cXnvEECOhU
— St₳ke with Pride 🌈 SPO & DRep (@StakeWithPride) October 7, 2025
This move strengthens Cardano’s position in traditional finance. It also brings potential for fresh liquidity into the asset.
The Cardano Foundation released its 2025 roadmap with several major initiatives. The foundation is expanding its Web3 team and launching a large ADA liquidity fund for DeFi projects.
The plan includes adding 2 million ADA to its Venture Hub. The foundation will delegate 220 million ADA to new DReps for governance purposes.
A $10 million real-world asset project is starting. The marketing budget will increase by 12%.
Historical Pattern Emerges
Some analysts see a bigger picture forming. Javon Marks highlighted that ADA’s current chart pattern mirrors the setup from the last bull cycle.
After breaking out last cycle, $ADA (Cardano) went on to meet three of its target and prices, which recently broke out again, looks to be on track to meet targets yet again.
First up is an over 221% run to ~$2.77 but, we see a run like last cycle and this could lead up to ~$7.82… https://t.co/Q4uaa5NFi2 pic.twitter.com/YfGA4w8i8o
— JAVON⚡️MARKS (@JavonTM1) October 4, 2025
During 2020 and 2021, ADA rallied from around $0.05 to a peak of $3.10 by September 2021. That surge was powered by the Shelley Upgrade, which introduced staking to the network.
At one point, over 70% of ADA’s supply was locked up in staking. This helped build a strong community that remains active today.
The current macro pattern shows similarities. Long accumulation phases followed by breakouts have preceded major rallies in past cycles.
If this pattern repeats, analysts point to potential upside targets. Key levels include $2.77, $3.29, and $3.74 based on Fibonacci levels and historical price zones.
For the bullish scenario to play out, Cardano needs to hold above $1.00. A recovery above $0.84 that holds could trigger a move toward the $1.00 psychological level.
The contrast between short-term weakness and long-term potential creates an interesting setup. CryptoQuant data shows negative Spot Taker CVD values rising since mid-July, while the long-to-short ratio of 0.89 indicates bearish positioning in derivatives markets.


