


 Price: Will S&P Index Listing Push Token Above $1?")


TLDR
- Cardano was added to the S&P Digital Markets 50 Index, giving it more exposure to institutional investors
- ADA price is trading inside a symmetrical triangle pattern near $0.82, showing reduced volatility before a potential breakout
- Strong buy walls exist near $0.78 and the token holds above its 50-week moving average
- On-chain data shows increased profit-taking activity and bearish bets reached their highest monthly level
- Key resistance sits between $0.95 and $1.00, while support lies around $0.78-$0.80
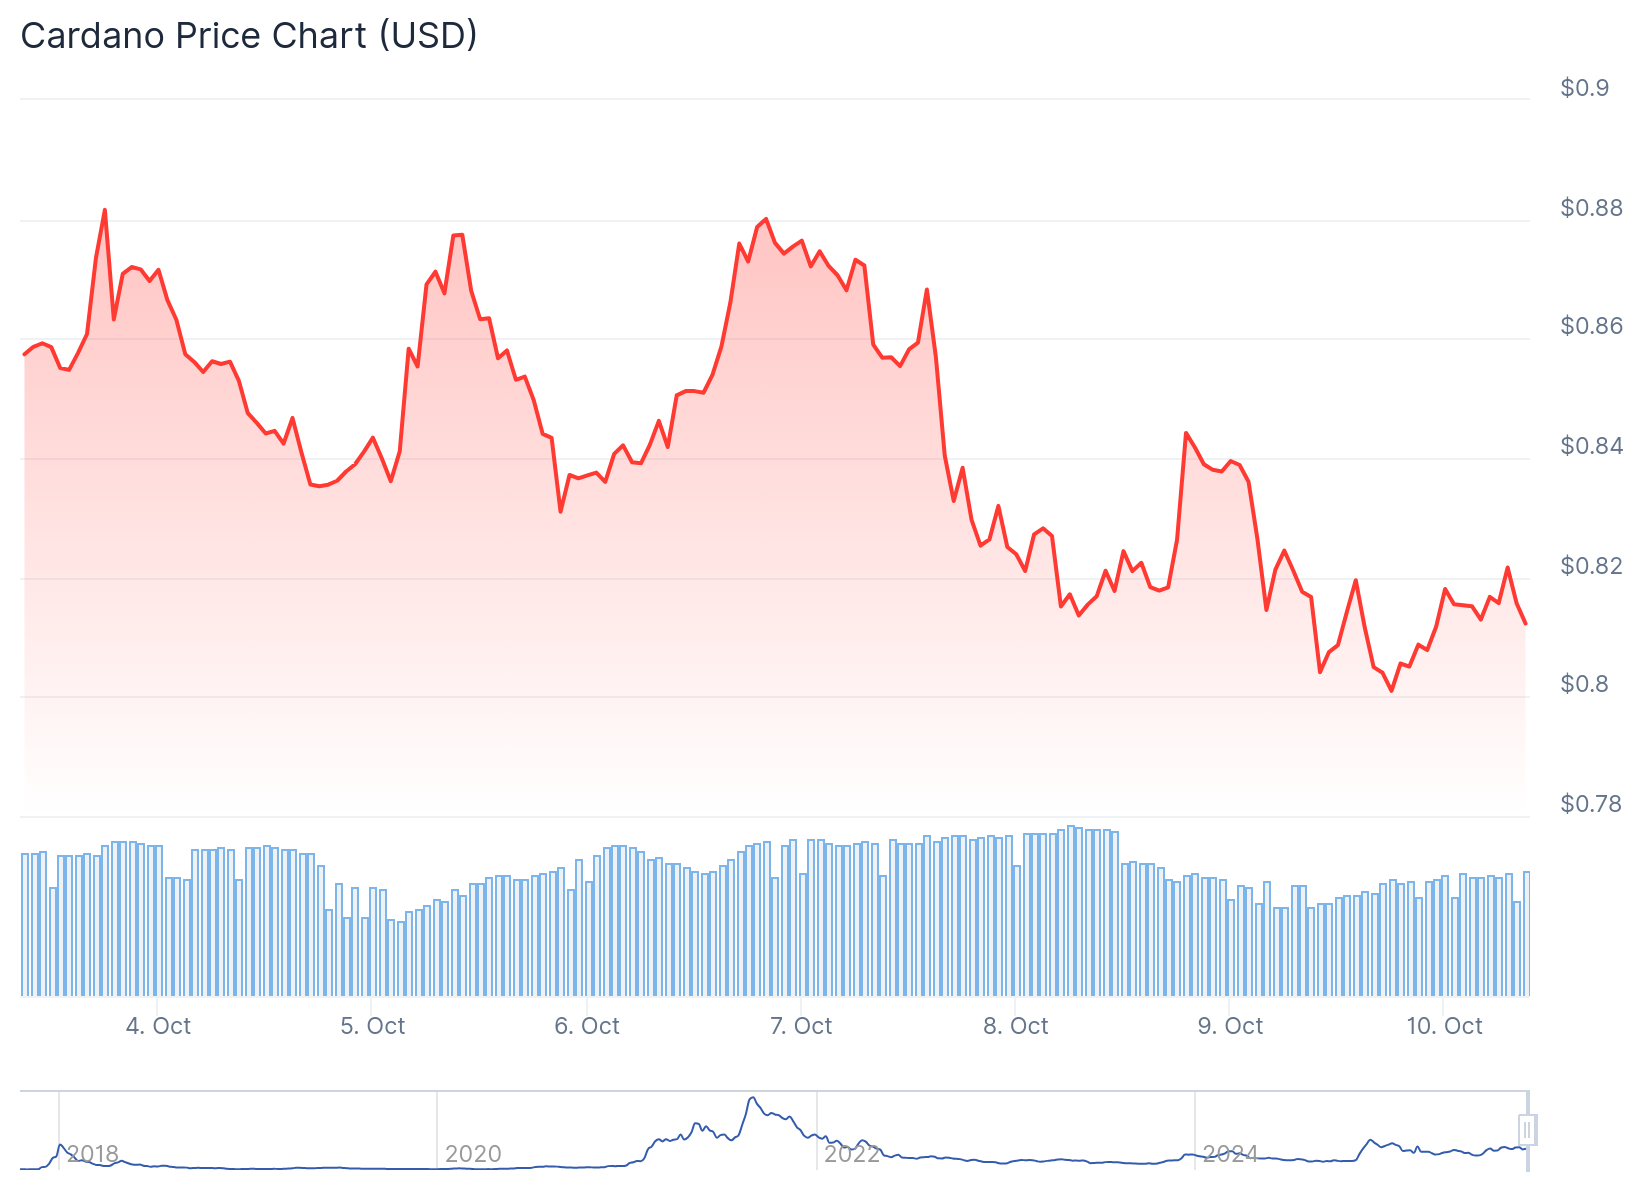
Cardano price traded near $0.82 in early October 2025 as investors watched whether recent institutional developments could push the token above the $1 level. The altcoin fell more than 3% during the week while traders evaluated mixed signals from technical and on-chain data.
The network joined the S&P Digital Markets 50 Index in recent weeks. The index tracks the 50 most relevant digital assets for traditional finance participants.
Data platform TapTools reported that index inclusion often enhances credibility for crypto projects. Funds that track or benchmark against indices may allocate capital to included assets.
S&P Global just launched a new index tracking the top 50 digital assets.
Cardano $ADA made the list.
The S&P Digital Markets 50 bridges traditional finance and on-chain markets, and it’s another step toward institutional accessibility for Cardano.
https://t.co/FnaHOmARZy pic.twitter.com/usroJh0DG7
— TapTools (@TapTools) October 8, 2025
This listing puts Cardano alongside Bitcoin and Ethereum in a global benchmark. Analysts said the move signals growing recognition from traditional markets beyond retail traders.
The development came during renewed speculation about altcoin exchange-traded products. Market participants continue to assess how approved ETF applications could reshape capital allocations.
Technical Pattern Shows Tightening Price Action
Technical analysts observed that Cardano price compressed inside a symmetrical triangle pattern. Analyst TheDAppAnalyst noted the range was tightening as it approached the triangle’s apex.

The pattern typically appears before volatility expansion. It indicates equilibrium between buyers and sellers with neither side establishing dominance.
A move above $0.90 resistance could confirm bullish continuation. Sustained closes below $0.78-$0.80 risk breaking the pattern downward.
At press time, ADA traded around $0.81 on Friday. The token showed a 0.27% gain in 24 hours but posted a 5.04% decline over the past week.
Monthly losses reached 7.39%. The relative strength index hovered near neutral territory at 45, suggesting neither overbought nor oversold conditions.
Cardano maintained closes above its 50-week exponential moving average. This trend indicator sits around the $0.77-$0.80 band and serves as a critical support zone.
$ADA is staying nicely above the 50 Week MA.
Last time we had this kind of formation, we ended up pumping to $1.
Same could happen this time and it could be the moment $ADA breaks the bull market doors and heads into a new ATH. https://t.co/XVv7YpUDg7 pic.twitter.com/cz4hJOx9yg— Sssebi🦁 (@Av_Sebastian) October 8, 2025
Analysts said holding above the 50-week EMA keeps the bullish scenario intact. The last time ADA defended this average, the token advanced toward $1.
Key resistance levels remain between $0.95 and $1.00. This represents the upper threshold needed for a confirmed bullish reversal.
On-Chain Data Reveals Mixed Signals
Order book analysis revealed a dense buy wall near $0.78. Market data aggregator CW8900 reported that bids repeatedly absorbed selling pressure in that range.
This level acts as both psychological and structural support. The pattern suggests traders are positioning for medium-term recovery rather than short-term speculation.
However, Santiment’s Network Realized Profit/Loss metric showed increased profit-taking this week. The metric spiked on Thursday to its highest level since September 23.
This spike indicates holders are selling their bags at a profit. The activity increases selling pressure on the token.
CoinGlass data showed the ADA long-to-short ratio stood at 0.81 on Friday. This marked the highest bearish level in over a month.
The ratio below one reflects bearish sentiment in derivatives markets. More traders are betting on the asset price to fall.
The Moving Average Convergence Divergence indicator flipped a bearish crossover on Thursday. This technical signal suggests the start of a potential downward trend.
If ADA breaks and closes below the ascending trendline, it could extend correction toward the next daily support at $0.70. If the token recovers and closes above $0.84, it could rally toward the psychological $1 level.


