


TLDR
- Solana’s daily transaction count has dropped by nearly 50 percent in recent weeks.
- The decline in network activity comes despite a strong rally in Solana’s price.
- CryptoQuant analysts highlight a negative divergence between price and transaction volume.
- Most of the decline may be due to a reduction in validator voting activity on the network.
- Solana remains above key moving averages which signals continued bullish momentum.
Solana’s daily transaction count has plunged nearly 50% in recent weeks, despite the token’s continued price rally. Analysts now see a widening gap between Solana’s network activity and its market valuation. This divergence raises concerns about the sustainability of the rally as price action becomes increasingly disconnected from on-chain fundamentals.
Solana Price Climbs as Network Activity Weakens
Solana has experienced a sharp contraction in on-chain activity, with daily transactions dropping to nearly half of their July levels. According to CryptoQuant, transactions dropped from around 125 million on July 24 to almost 64 million by October 10. This fall occurred while Solana’s price surged, forming a negative divergence that signals a potential imbalance.
The price of Solana rallied above $240 earlier this month before pulling back to the $221 level, a 3.5% daily drop. However, the token continues to trade well above key moving averages, including the 50-day, 100-day, and 200-day lines. These indicators suggest bullish momentum remains intact, even as usage metrics decline.
CryptoQuant’s analyst, Crypto Onchain, emphasized the concern: “This pattern often reflects speculative buying rather than real network growth.” The disconnect has led to increased scrutiny on whether Solana’s valuation accurately reflects its actual utility or is driven by speculative enthusiasm.
Structural Shifts or Fundamental Weakness?
The drop in activity could stem from changes in Solana’s internal mechanisms, rather than a decline in user engagement. Historically, 80–90% of Solana’s transactions are related to validator voting, which maintains network consensus. If these voting transactions decreased, it may not mean user interest is fading.
However, if the decline affects DeFi, NFTs, or token transfers, it could indicate more profound weakness in Solana’s core use cases. CryptoQuant’s data has not yet clarified whether the drop impacts user-generated transactions or only internal network operations. Thus, the interpretation of this decline remains critical to assessing Solana’s actual market health.
While bulls argue that structural adjustments are underway, others remain skeptical about the timing. A fall in ecosystem usage, even during a rally, is often considered a signal of speculative froth. Analysts continue to monitor transactional breakdowns to evaluate the cause of this contraction better.

Price Structure Remains Bullish Despite Divergence
Solana’s price still holds a bullish structure despite recent volatility and declining on-chain metrics. The $210–$215 support zone, aligning with the 50-day moving average, remains a key level for bulls to defend. As long as Solana stays above this zone, the uptrend remains valid in the short term.
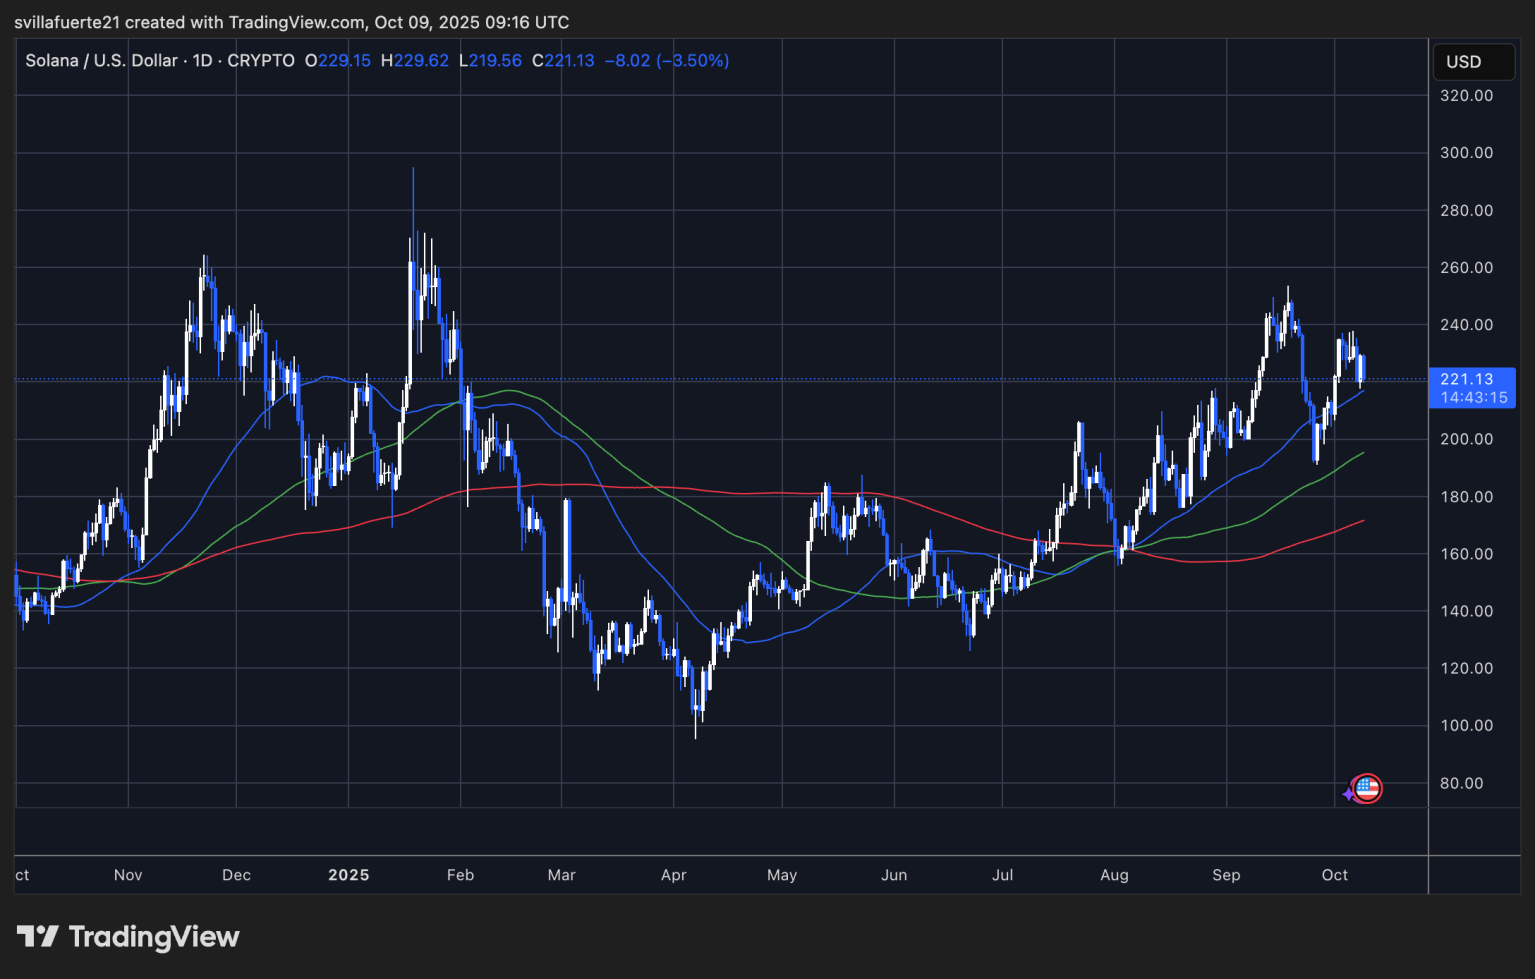
A break above $240 could reignite bullish momentum, with a target of $280, last seen in late 2024. On the other hand, a dip below $210 may lead to a deeper correction, with support near $190. The market now waits for confirmation on whether the next move will resume the rally or test lower levels.


