


TLDR
- XRP is trading at $2.60 with an 8.76% gain in 24 hours and a market cap of $156.80 billion.
- Analysts point to a capitulation pattern similar to 2017, which led to a major rally six weeks later.
- Key resistance levels are at $2.75 and $3.65, while support holds around $2.00 to $2.30.
- Veteran trader Peter Brandt called XRP’s chart “a purer long-term chart” due to its textbook technical patterns.
- XRP’s near-term direction depends heavily on Bitcoin’s market movement and dominance levels.
XRP is trading at $2.60 at press time. The token has gained 8.76% over the past 24 hours. Trading volume reached $15.73 billion in the same period.
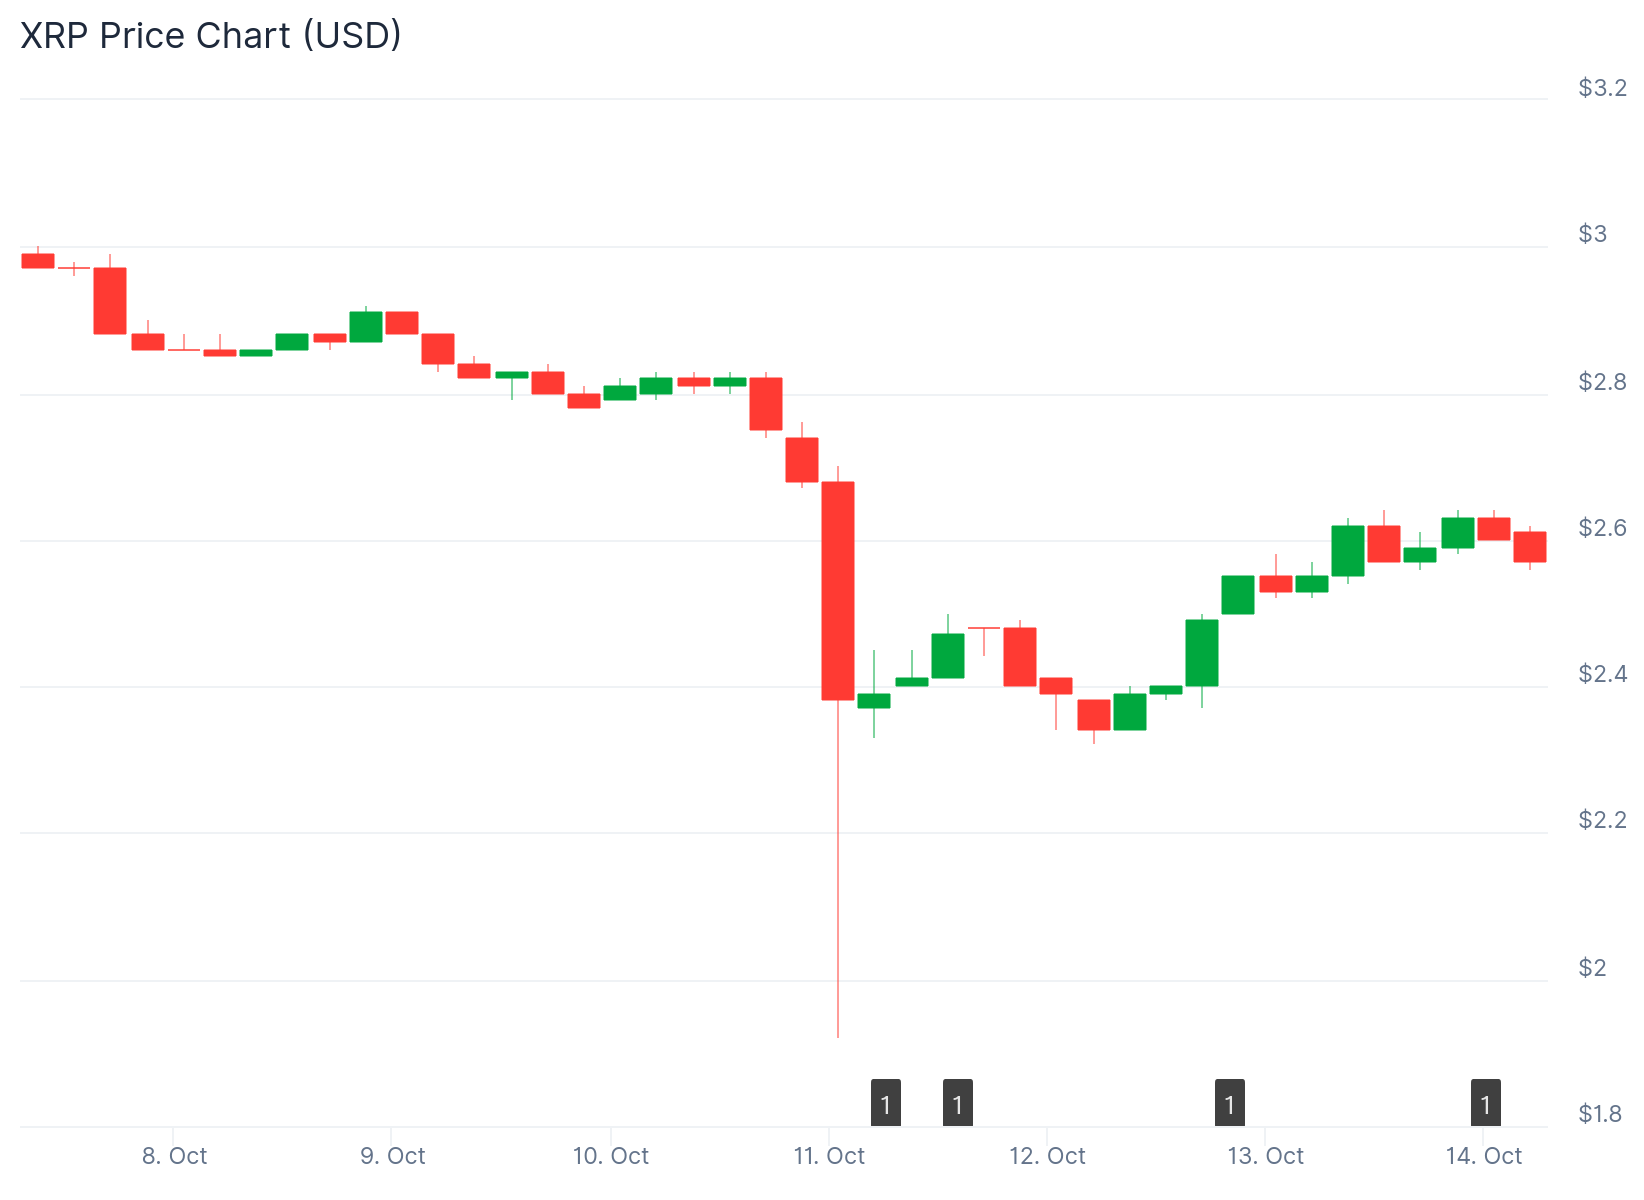
The token’s market capitalization stands at $156.80 billion. This recovery comes after a recent dip in price. The bounce has renewed interest from traders and investors.
Crypto analyst CRYPTOWZRD identified a capitulation pattern in XRP’s price action. He compared the current pattern to events in 2017. Back then, a similar capitulation was followed by a major rally six weeks later.
⚠️ NOT THE END 🔥
Capitulation doesn’t mark the end…
🔮 Back in 2017 $XRP had a huge capitulation wick, 6 weeks later it exploded upside and never looked back… it just had the same capitulation event 🤯
Can it repeat? 🚀 pic.twitter.com/hZnlXnuXJr
— CRYPTOWZRD (@cryptoWZRD_) October 12, 2025
He noted that both XRP and XRP/BTC finished the day positively. He stated that continued upward movement in XRP/BTC depends on Bitcoin Dominance decreasing. The analyst plans to watch intraday charts for short-term trading opportunities.
The weekly candles for XRP and XRP/BTC closed slightly bearish due to a liquidation cascade. Most of the downward movement has already occurred. The daily chart shows a bullish close, indicating returning confidence in the token.
Key Resistance Levels to Watch
The first major resistance level sits at $2.75. Breaking above this price point could push XRP toward the next resistance at $3.65. Failure to hold above $2.75 may result in sideways trading.

Liquidation of leveraged positions could impact XRP’s spot market price. Support levels are located at $2.30 and $2.00. A pullback could lead to a selloff toward these support zones.
Intraday trading showed volatility as XRP tested resistance at $2.55. Trading above this level might trigger a near-term upward move. Analysts recommend waiting for clearer chart patterns before entering new positions.
Technical Analysis Draws Attention
Veteran trader Peter Brandt recently commented on XRP’s long-term chart. He called it “a purer long-term chart” due to its adherence to classical technical patterns. The weekly chart shows several symmetrical triangles formed during consolidation phases.
As a student of classical charting principles and history, has there ever been a purer long-term chart? $XRP pic.twitter.com/rbA2Mp955A
— Peter Brandt (@PeterLBrandt) October 13, 2025
Similar patterns appeared between 2014-2017 and 2020-2024. Both periods preceded upward breakouts. Current resistance sits near $2.83 around the simple moving average.
The ADX momentum indicator reads 21.52. This reading suggests weak trend strength currently. It also indicates potential for increased volatility ahead.
Ripple’s partial legal victory over the SEC in 2023 clarified XRP’s status in certain contexts. This development brought institutional players back into the market. Ripple continues to develop cross-border payment solutions using XRP.
XRP historically mirrors Bitcoin’s bull cycles. The token often shows magnified moves once momentum builds. Breaking above $3.00 is viewed as crucial for triggering another sustained rally.
XRP’s near-term direction will largely follow Bitcoin’s market sentiment. A retest of support near $2.00 remains possible before any breakout occurs. The token pushed resistance at $2.55 during intraday trading, showing continued testing of higher levels.


