


 Price: Analysts Warn of Potential Drop to $108k Support Level")


TLDR
- Bitcoin rallied to $115,963 on October 13 but was rejected at the $115.3k-$117k resistance zone, falling 3.54% to $111,800
- Analysts estimate a 60%-75% chance Bitcoin will retest its October 10 lows, with potential for another sharp decline this week
- Binance received $590 million in USDT inflows via the TRON network, while derivatives exchanges saw increased stablecoin activity on Ethereum
- Stablecoin inflows show buying power but also increase the risk of a liquidity hunt downward, particularly affecting leveraged positions
- Only 10% of Binance altcoins are trading above their 200-day moving average, with many experiencing 40%-70% drops on October 10
Bitcoin experienced a strong rally on October 13, climbing to $115,963. This represented a 5.84% gain from the previous day’s low of $109,500.
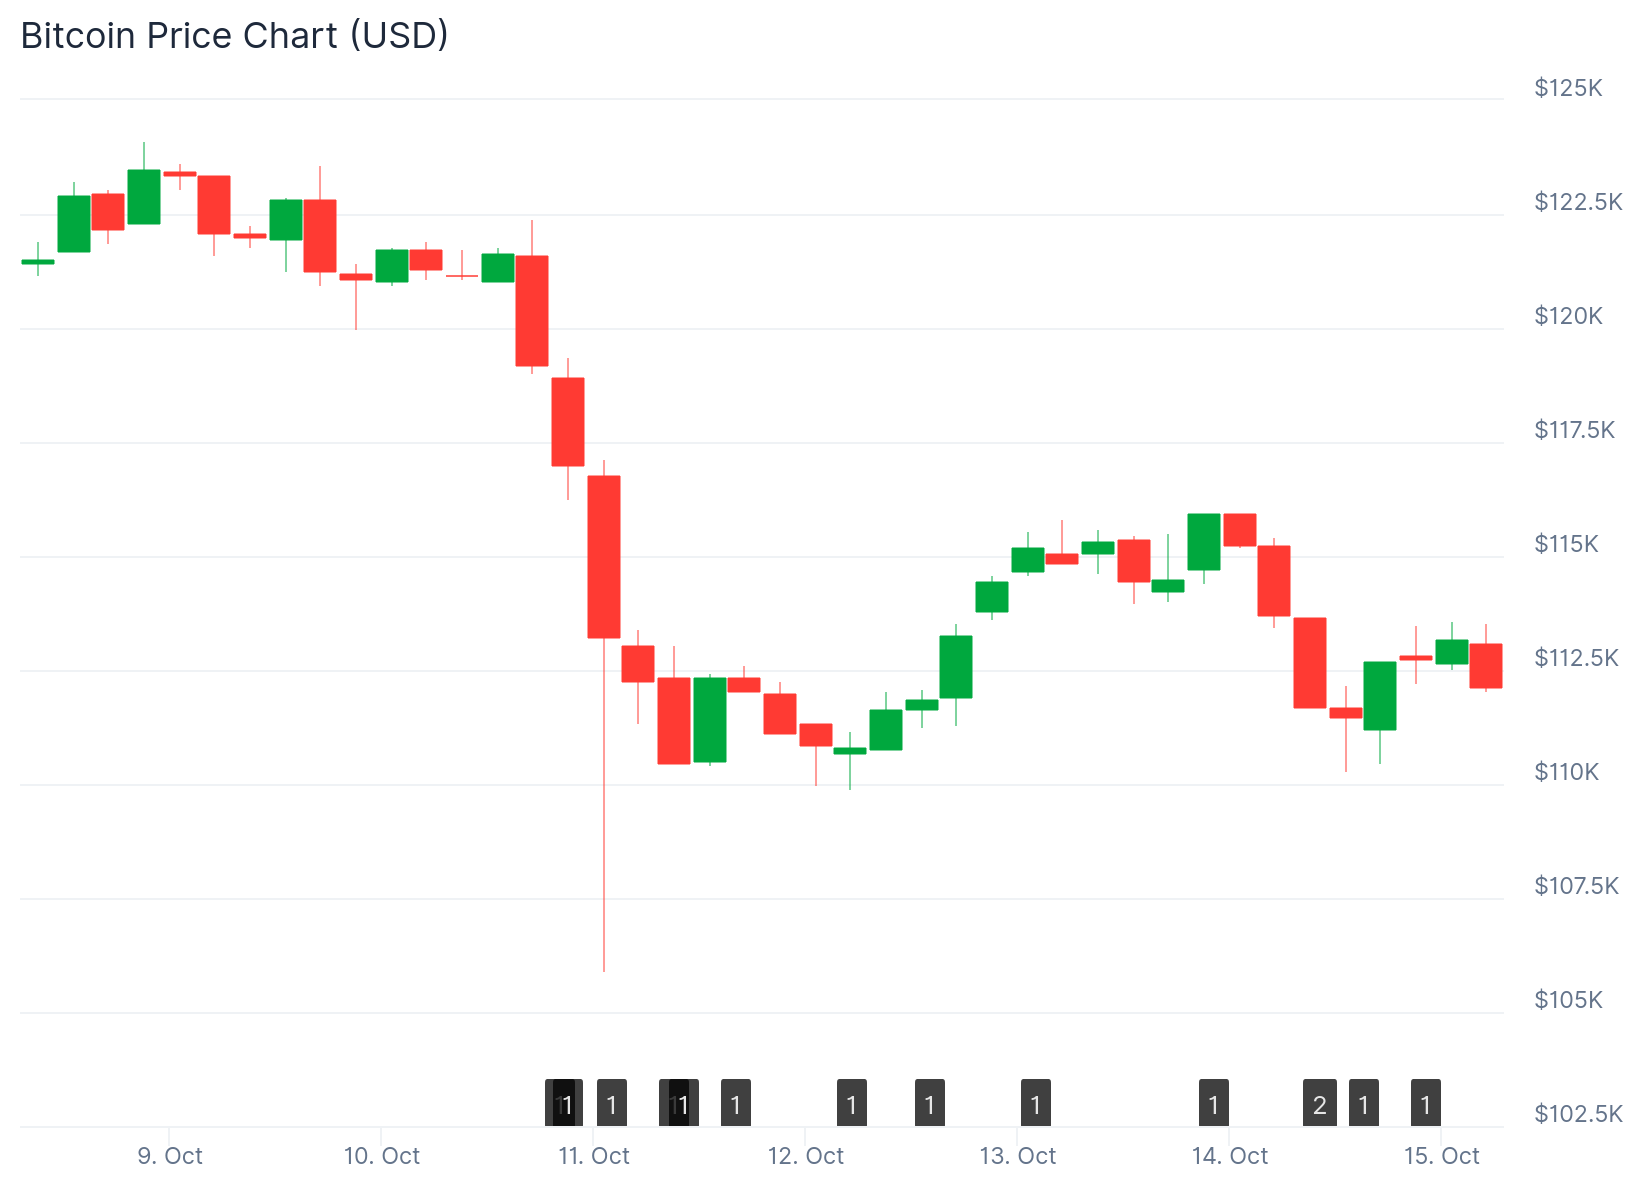
The upward momentum came to a halt at the key resistance zone between $115,300 and $117,000. Bearish pressure forced the price to retreat from this supply zone.
Following the rejection, Bitcoin prices fell 3.54% to reach $111,800 at the time of writing. The cryptocurrency is now trading below the $115,000 level and the 100-hour simple moving average.
A bearish trend line is forming with resistance at $118,250 on the hourly chart. The short-term bias remains bearish unless buyers manage to flip the $117,000 region to support.
Stablecoin Inflows Signal Increased Market Volatility
Binance saw $590 million in Tether inflows via the TRON network in recent days. TRON is the preferred network for stablecoin settlement among traders.

These inflows occurred at the same time Bitcoin pushed above $115,000. The timing highlighted increased buying power in the market.
The stablecoin activity was accompanied by increased movement from whale wallets holding over $100 million. Analysts noted this pattern increases the chances of a sharp price move in either direction.

Derivatives exchanges received a bulk of stablecoin inflows on the Ethereum network. This shows market participants are buying the dip using margin trading.
While this demonstrates bullish conviction, it also creates vulnerability. Another downward move could trigger liquidations of these leveraged positions.
Joao Wedson, CEO and Founder of analytics platform Alphractal, provided specific probability estimates. He places a 60-75% chance that Bitcoin will retest its lows from October 10.
This potential retest could trigger another price drop this week. Such a move would catch overly optimistic bulls off guard.
Technical Levels and Support Zones
The immediate resistance on the upside sits near $114,000. The first key resistance level is at $115,000.
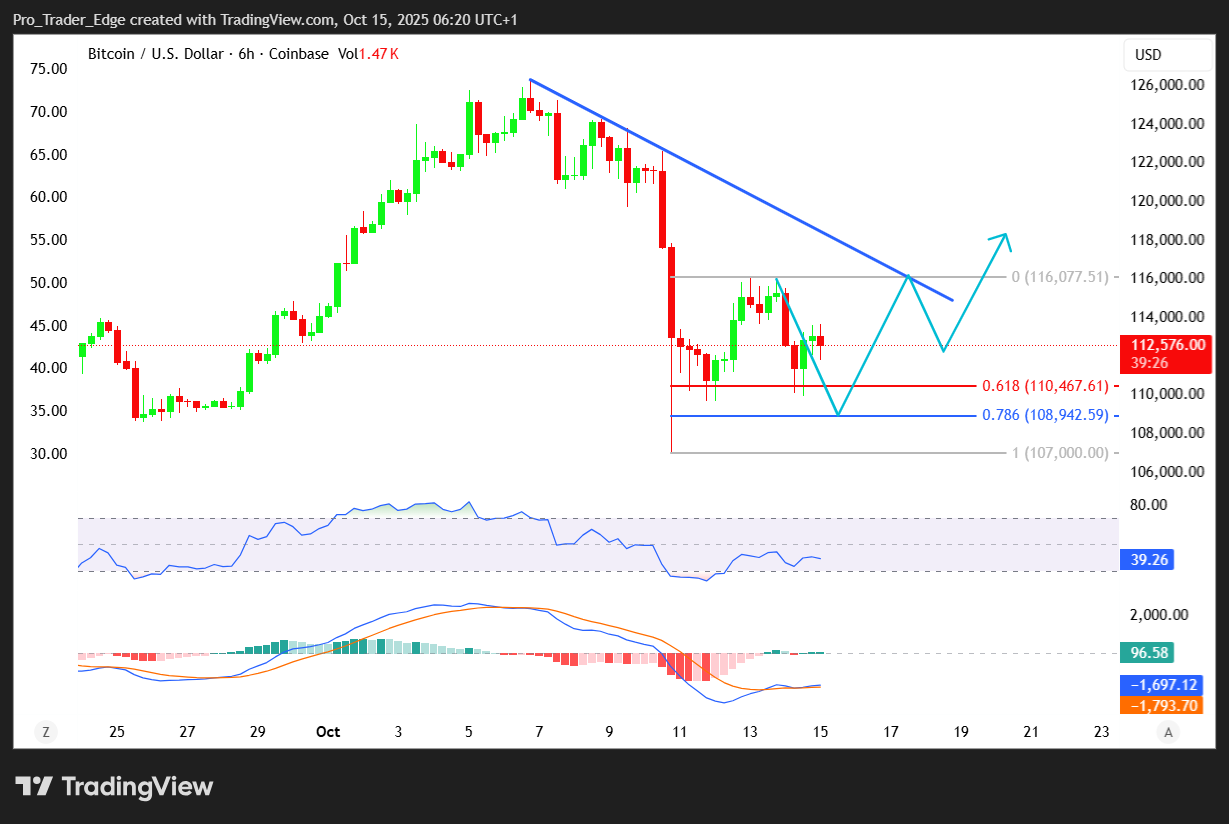
If Bitcoin manages to break above $116,000, the price could test $117,200. This level corresponds to the 76.4% Fibonacci retracement of the downward move from the $122,498 swing high to the $100,000 low.
On the downside, immediate support is near $111,800. The first major support sits at $110,500.
The next support zone is at $110,200. A drop below this level could send the price toward $108,500 in the near term.
The main support sits at $107,000. Below this level, Bitcoin might struggle to recover in the short term.
Technical indicators show the hourly MACD is gaining pace in the bearish zone. The Relative Strength Index for BTC/USD is now below the 50 level.
Traders should brace for further downside but can shift to a short-term bullish outlook if the price rallies past $117,000. A close above $116,000 might send the price higher toward the $117,250 level.
The price is trading below $115,000 and the 100-hour simple moving average at the time of writing. Bitcoin recovered above the 61.8% Fibonacci retracement level of the downward move from $122,498 to $100,000 before facing renewed selling pressure.


