


 Price Consolidates as Forward Industries Moves $192 Million to Coinbase")


TLDR
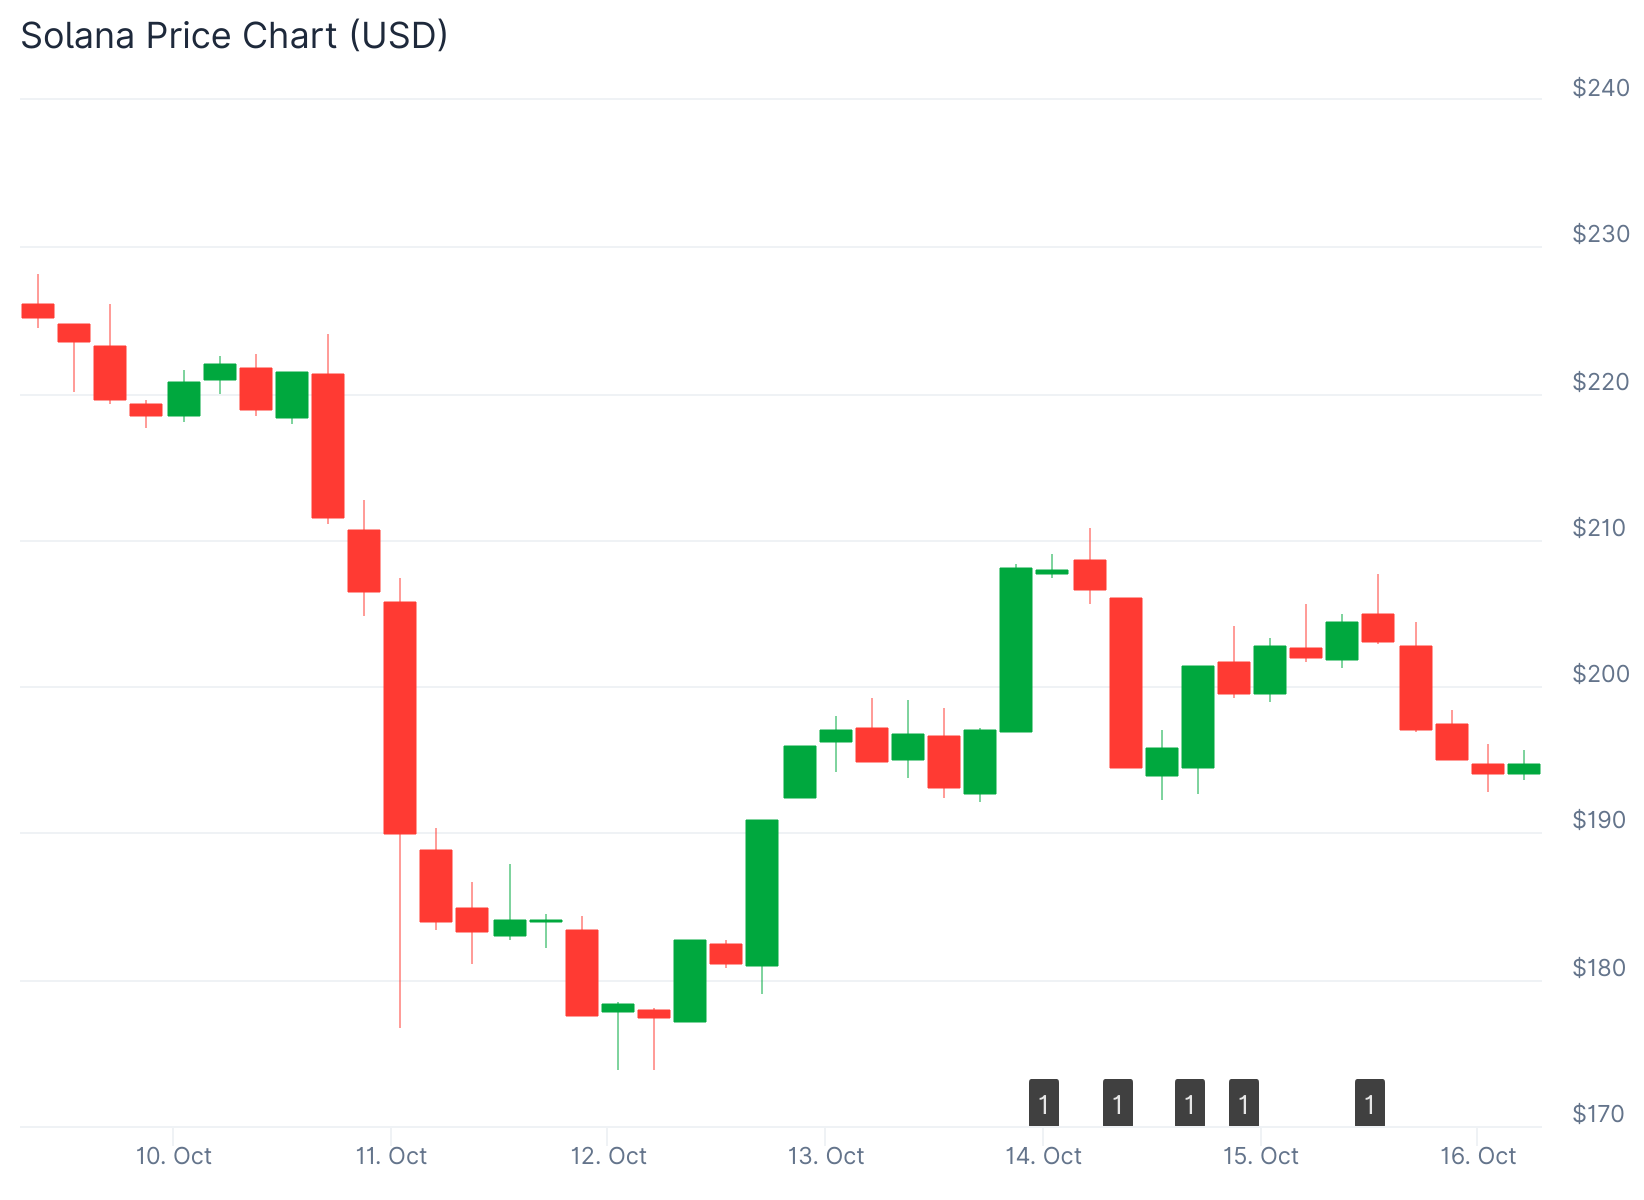
- Solana is trading at $201.87 with a market cap of $110.36 billion after breaking an 18-month reaccumulation range
- VanEck updated its Solana Staking ETF proposal with a 0.30% management fee, pending SEC approval
- Forward Industries transferred $192 million worth of SOL to Coinbase Prime while Solana Strategies bought 88,433 SOL tokens
- Technical indicators show SOL breaking above key support at $200 with potential targets at $250 and $262
- Funding rates turned positive at 0.005% indicating growing trader confidence in long positions
Solana has gained attention after breaking out of an 18-month consolidation pattern. The cryptocurrency is trading at $201.87 with a market capitalization of $110.36 billion.
The price jumped 1.18% in the past 24 hours but fell 9.26% over the last week. Trading volume dropped 21.34% to $10.73 billion, showing investor hesitation.
VanEck has updated its filing for a Solana Staking ETF with a 0.30% management fee. The fund will trade under the ticker VSOL if approved by the SEC.
⚡️SOLANA ETF UPDATE!
VanEck has filed an updated its #Solana Staking ETF proposal. Now, with a 0.30% fee. pic.twitter.com/Nqx5XAdvOz
— Coin Bureau (@coinbureau) October 15, 2025
The ETF combines price exposure with staking rewards. Investors would earn passive yield through validator participation.
The filing includes regulated custody and liquidity buffers for staking risks. SEC approval is still pending.
Forward Industries moved 993,058 SOL worth approximately $192 million to Coinbase Prime. The firm also sent $50 million to Galaxy Digital.

Forward Industries previously purchased $1.38 billion worth of Solana at $232 per token. The recent transfer may signal portfolio restructuring.
Institutional Activity Shows Mixed Signals
Solana Strategies took the opposite approach by adding to its holdings. The company bought 88,433 SOL at an average price of $193.93.
The purchase included 79,000 locked tokens from the Solana Foundation. Solana Strategies now holds 523,433 SOL in its treasury.
This split in institutional behavior shows different views on market timing. Some holders are reducing exposure while others are accumulating.
Solana broke free from its 18-month reaccumulation range after retesting the breakout zone. The asset bounced back above $200, confirming renewed strength.
Technical Analysis Points to Recovery
Analysts identify $250 as the next resistance level before price discovery begins. A move above that point could lead to continued gains.

The price sits below the 20-day exponential moving average at $210.70 and the 50-day EMA at $211.22. The 100-day EMA at $199.93 and 200-day EMA at $186.88 provide support levels.
The Relative Strength Index stands at 44.83, below the neutral 50 level. This shows limited buying momentum.
The MACD indicator remains bearish but is forming convergence. This pattern suggests a possible trend reversal ahead.
Solana rebounded from the $176 demand zone and regained momentum within its ascending channel. The 9-day moving average crossed above the 21-day moving average.
A break above $222 resistance could push prices toward $262. The RSI reached 49.41, showing recovering buying strength.
Funding rates in derivatives markets turned positive at 0.005%. This indicates more traders are opening long positions.
Positive funding rates mean traders are willing to pay premiums for upside exposure. This shift typically happens when sentiment recovers from bearish conditions.


