


 Price: Symmetrical Triangle Sets Up for Explosive Move in Q4")


TLDR
- Cardano (ADA) is trading near $0.62, a critical support level that needs to hold for a potential rally toward $1.90
- The cryptocurrency has been forming a symmetrical triangle pattern throughout 2025, with a breakout expected in late Q4
- MACD and RSI indicators show mixed signals, with the MACD line narrowing its gap with the signal line and RSI at 40
- Futures open interest has dropped from $1.8 billion in mid-September to $648.56 million, showing reduced leverage and cautious market sentiment
- ADA is approaching a descending trendline from early October, with a breakout above this line potentially opening the path to $0.70 and higher
Cardano is trading just above $0.62, a price level that has become the focus for traders watching the cryptocurrency. This support zone aligns with the 0.5 Fibonacci retracement level. It also forms the base of a long-term triangle pattern that started in early 2025.
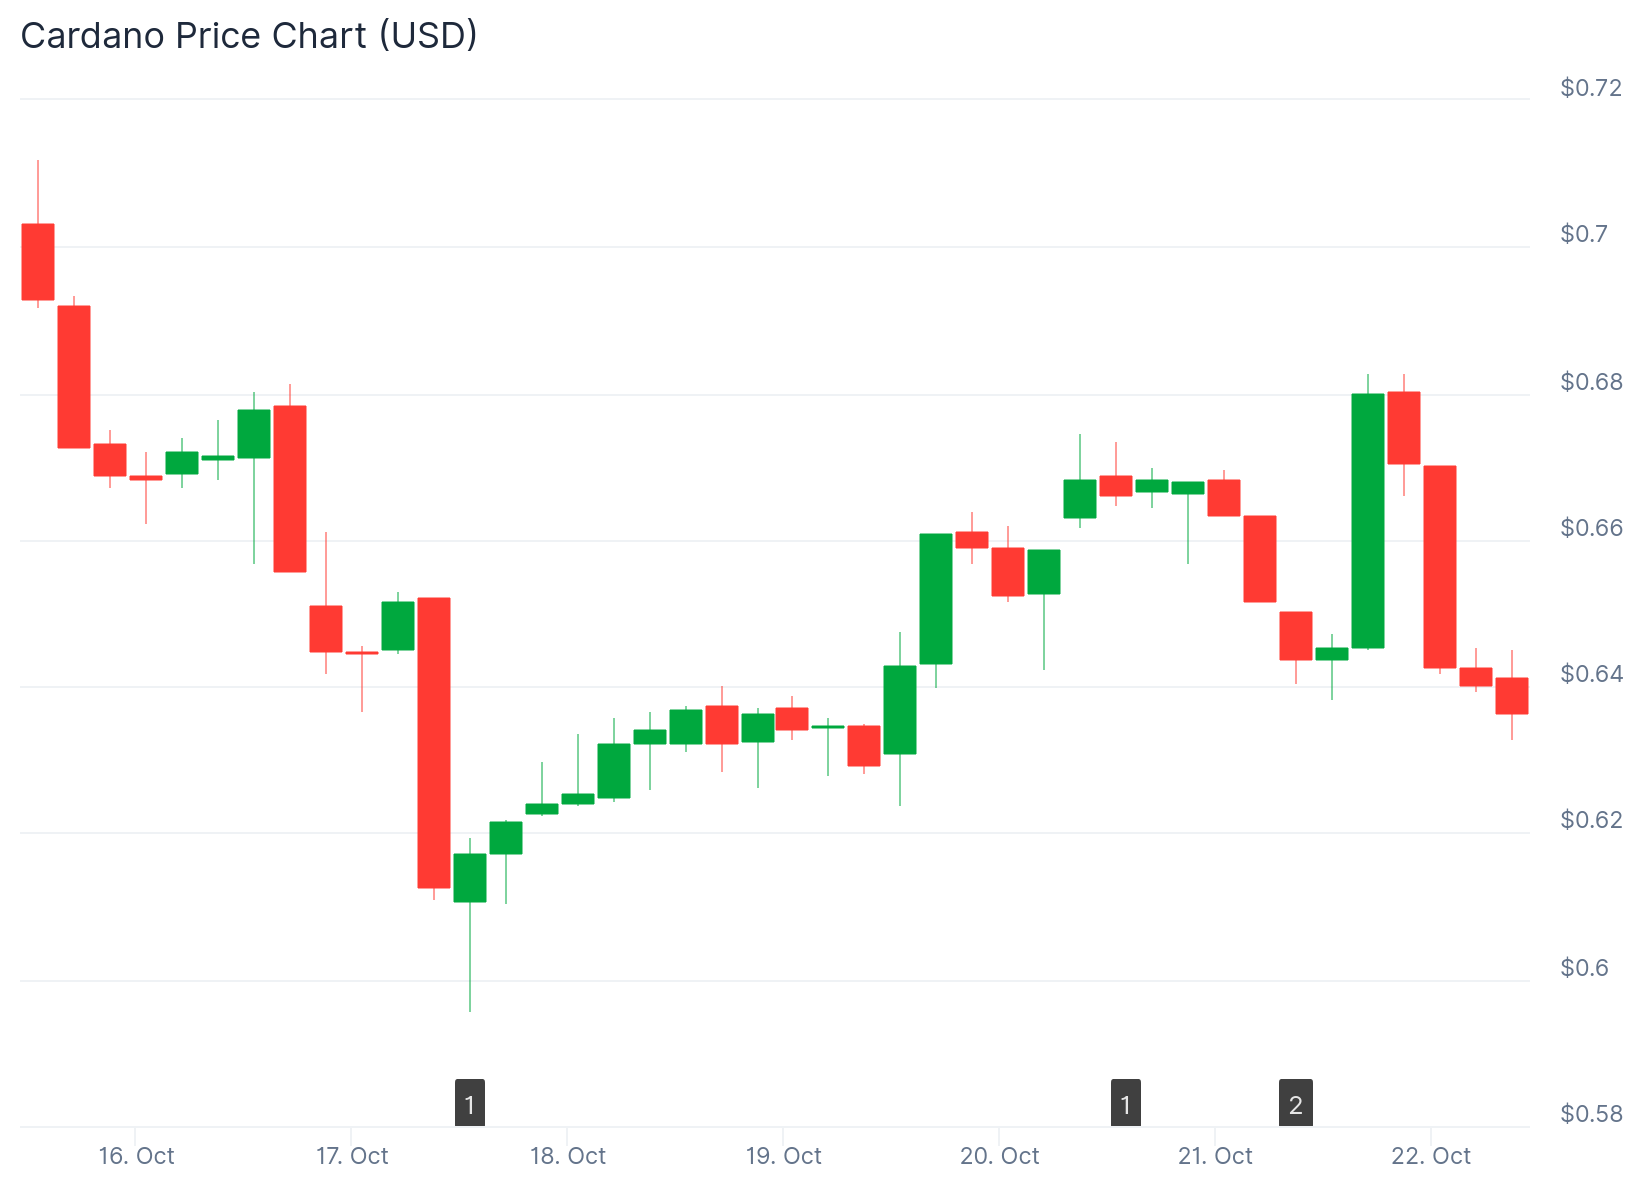
The current price sits around $0.64. If ADA stays above $0.62, the technical setup remains valid. A sustained close below this level could weaken the pattern and trigger further selling.
Crypto analyst Ali Charts explained the importance of this level. According to Ali, $0.62 must hold as support for Cardano to have a real shot at breaking out toward $1.90. The triangle pattern has been compressing for nearly a year now.
$0.62 must hold as support for Cardano $ADA to have a real shot at breaking out toward $1.90. pic.twitter.com/INQ5TRHcu4
— Ali (@ali_charts) October 21, 2025
The price has been moving between converging trendlines for months. This creates what traders call a symmetrical triangle. These patterns typically come before large price moves. With the pattern reaching its apex in late Q4, a breakout appears close.
Fibonacci levels suggest possible upside targets near $0.95, $1.28, and $1.86 if the pattern holds. These levels represent areas where previous price action showed strong reactions. They are not random numbers but zones where momentum could pause or speed up.
Another analyst named Sheldon shared a short-term chart showing ADA approaching a descending trendline. This trendline has been in place since early October. Sheldon noted that ADA is looking strong and close to the momentum trend.

Short-Term Price Action
The cryptocurrency is trading inside a support zone between $0.6245 and $0.6106. This range has been tested several times. Buyers have stepped in each time to defend the level.
Price action is forming higher lows. This pattern may suggest steady demand at current levels. A clean move above the descending trendline would place ADA back into a short-term uptrend.
The chart includes a projected move showing a possible retest of the breakout level before continuing higher. This is common behavior after breakouts from compressed patterns.
The MACD indicator on the daily chart shows the MACD line at -0.05 and the signal line at -0.045. The MACD line remains slightly below the signal line. No crossover has occurred yet.
The gap between the two lines is narrowing. This may point to shifting momentum. The MACD histogram is showing reduced red bars, which suggests that recent selling pressure is fading.
The RSI currently sits at 40. This is below the neutral 50 line. It reflects a market that is still in a recovery phase. The reading shows that Cardano is not yet overbought.
Market Sentiment and Open Interest
Futures open interest for ADA stands at $648.56 million, according to data from Coinglass. This represents a sharp decline from more than $1.8 billion reached in mid-September. The drop followed a decline in price as ADA moved below the $0.70 level.
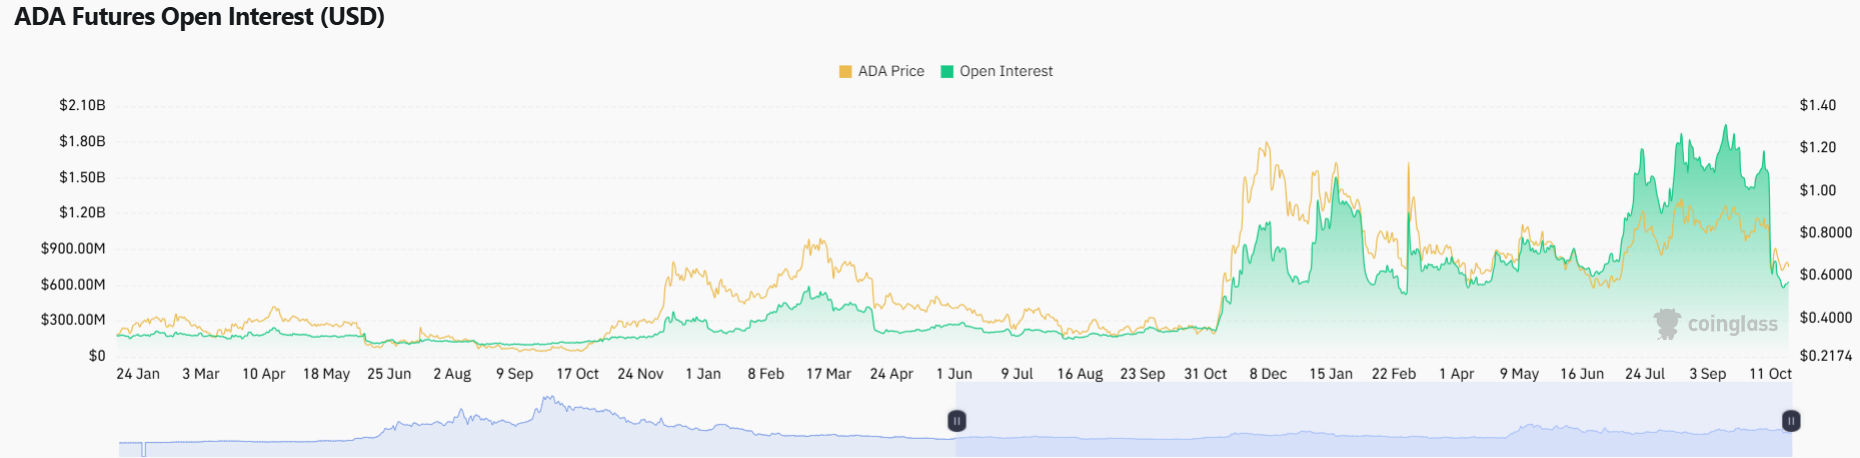
Lower open interest often reflects less leverage in the market. It shows a more cautious stance from market participants. In past cycles, drops in open interest followed by price stability have sometimes come before larger moves.
Traders are watching for volume and open interest to return before any clear shift. The reduction in leverage could mean that the market is less prone to sudden liquidations.
Beyond the technical setup, Cardano’s ecosystem has seen increased developer activity. The focus has been on AI applications and identity solutions. The Hydra and Mithril upgrades are improving scalability.
Institutional interest has picked up since Q3. This suggests larger players are positioning for a potential move. When technical setups align with improving fundamentals, the probability of a successful breakout increases.
The risk remains clear for traders. If $0.62 does not hold, the bullish structure breaks down. A sustained close below this level could extend consolidation into early 2026. It could push prices toward $0.50.
Cardano has historically found strong buying interest at Fibonacci mid-levels. This makes a complete breakdown less likely than a successful defense of support. For now, the $0.62 level remains the key price to watch.


