


 Price: Recovery Wave Stalls as Bears Take Control")


TLDR
- Ethereum is trading at $3,848 after a 0.55% decline in the last 24 hours with a market cap of $465.38 billion
- Bitmine purchased $183.93 million worth of ETH, creating optimism among traders
- ETH failed to break above its resistance level and retreated back to the $3,800 support zone
- Technical indicators including RSI and MACD show weakening momentum suggesting possible sideways movement
- The $3,800 support level is critical, with failure potentially leading to a drop toward $3,400-$3,600
Ethereum is currently trading at $3,848, showing a 0.55% decline over the past 24 hours. The token maintains a market capitalization of $465.38 billion with 24-hour trading volume reaching $54.12 billion.
The high trading volume reflects continued market activity despite recent price pressure. Market participants are closely watching how ETH performs at current levels.
Bitmine made a large purchase of $183.93 million worth of Ethereum tokens today. Crypto analyst Ted shared blockchain data revealing this transaction. The analyst believes several more purchases of this size could provide the momentum ETH needs to move higher.
Bitmine has bought $183,930,000 in $ETH today.
Ethereum needs a few more buyers like this for upward continuation. pic.twitter.com/sqvVxTUqP1
— Ted (@TedPillows) October 21, 2025
However, the market response has been cautious so far. Despite the whale activity, buyers have struggled to push the price past key resistance levels.
Failed Resistance Retest Creates Pressure
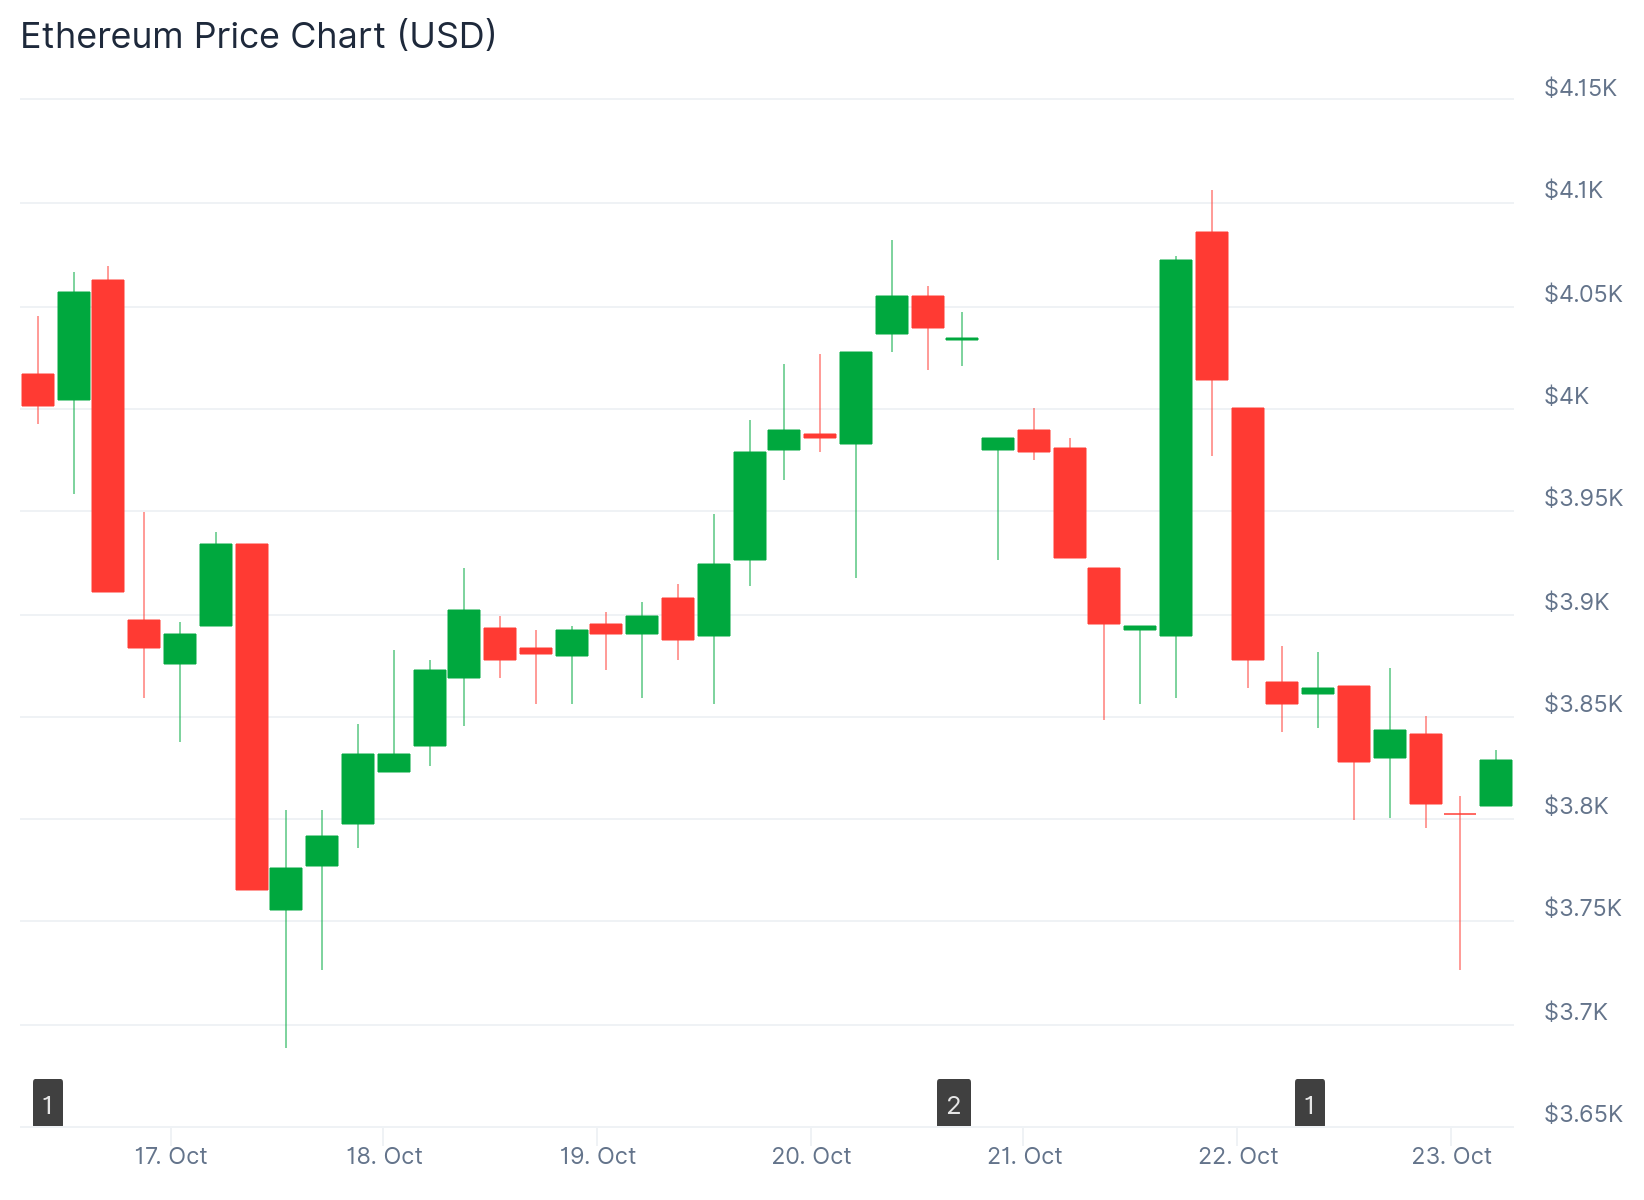
Ethereum recently attempted to break through a major resistance area but failed. Ted noted that ETH retested this resistance level but could not hold above it. After the failed attempt, the token slid back toward the $3,800 region.
This level now serves as an important support zone for Ethereum. If the $3,800 area holds, ETH could bounce back and attempt another move higher. A failure to maintain this support could push the price down to the $3,400-$3,600 range.

The coming days will likely determine Ethereum’s short-term direction. Traders are watching to see if $3,800 can provide solid footing for the next upward move.
Ethereum started a recovery wave from the $3,700 zone earlier. The price moved above $3,750 and $3,800 levels briefly. ETH cleared the 23.6% Fib retracement level from its recent downward move.
Bears became active near the $3,840 resistance zone. They prevented further upside movement. The price is now trading below $3,850 and the 100-hour Simple Moving Average.
Technical Indicators Signal Weakening Momentum
The weekly chart shows ETH’s RSI reading at 53.04, down from 64.56. This decline suggests buying momentum is weakening. The token may enter a period of sideways trading.
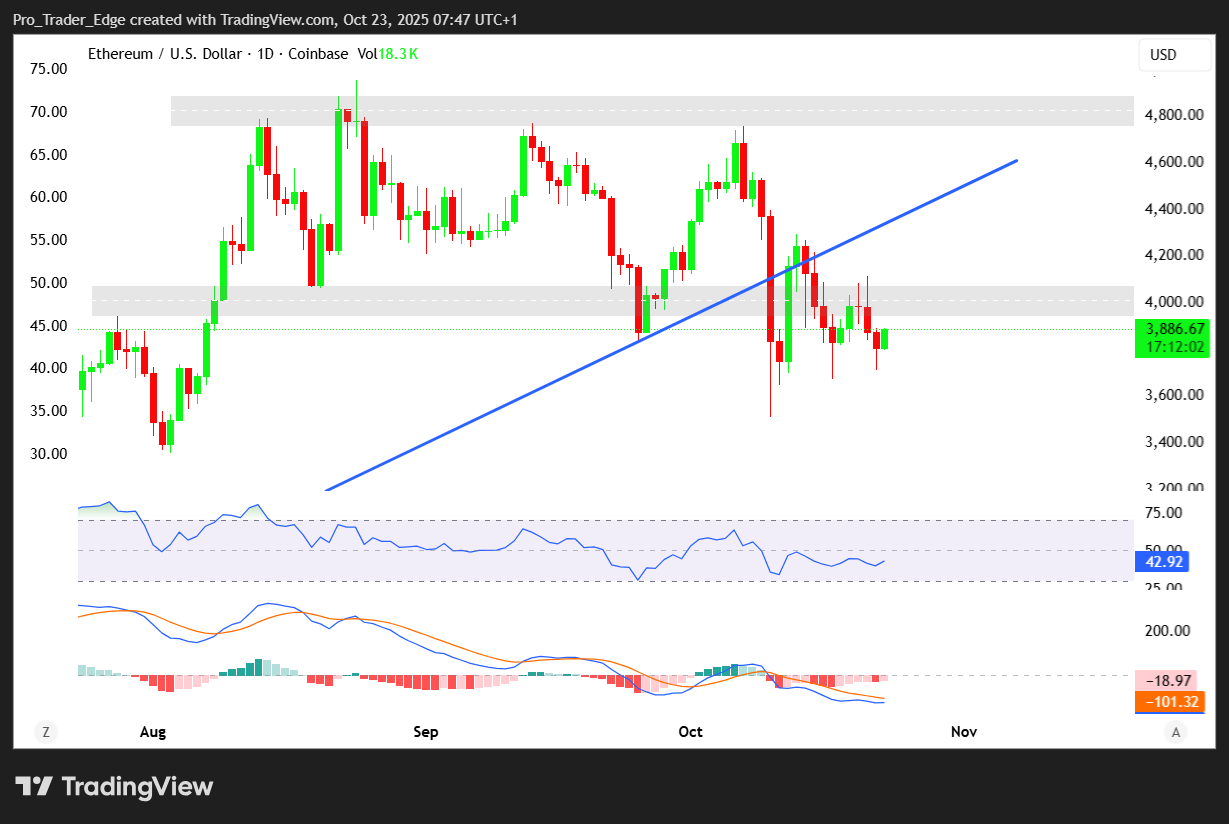
The Moving Average Ribbon provides support around $3,793 and $3,013. This indicates an upward correction structure remains intact if selling pressure eases.
The MACD indicator shows declining bullish momentum. The blue line crossed below the signal line at 386.42 versus 436.26. The histogram fell negative at -49.83.
This pattern indicates weakening momentum. Bears may maintain control in the short term unless ETH recovers the $4,000 zone quickly.
On the hourly chart, a short-term bearish trend line is forming. Resistance sits at $3,850. The next key resistance level is near $3,920, which represents the 50% Fib retracement level.
The first major resistance above that is near $3,950. A clear move above this level might send the price toward $4,020 resistance.
If Ethereum fails to clear the $3,850 resistance, a fresh decline could begin. Initial support on the downside is near $3,800. The first major support sits near $3,740.
A move below $3,740 might push the price toward $3,700 support. Further losses could send the price to $3,650 or even $3,620.
The hourly MACD is losing momentum in the bearish zone. The hourly RSI is now below the 50 level, indicating buyers are losing control as the market turns cautious.


