


TLDR
- XRP price is trading at $2.40, down 23% from its monthly high and 35% from its year-to-date peak
- The four-hour chart shows an inverse head-and-shoulders pattern forming with a head at $2.20 and left shoulder at $2.32
- The REX-Osprey XRP ETF (XRPR) has crossed $100 million in assets with continuous inflows since its September 18 launch
- Ripple USD (RLUSD) stablecoin has grown to $874 million in assets and is approaching the $1 billion milestone
- Key resistance levels sit at $2.42 and $2.50, while support levels are positioned at $2.32 and $2.27
XRP price is trading at $2.40 on October 22, reflecting a 23% drop from its highest point this month. The token has fallen 35% from its year-to-date high as the broader crypto market faces downward pressure.
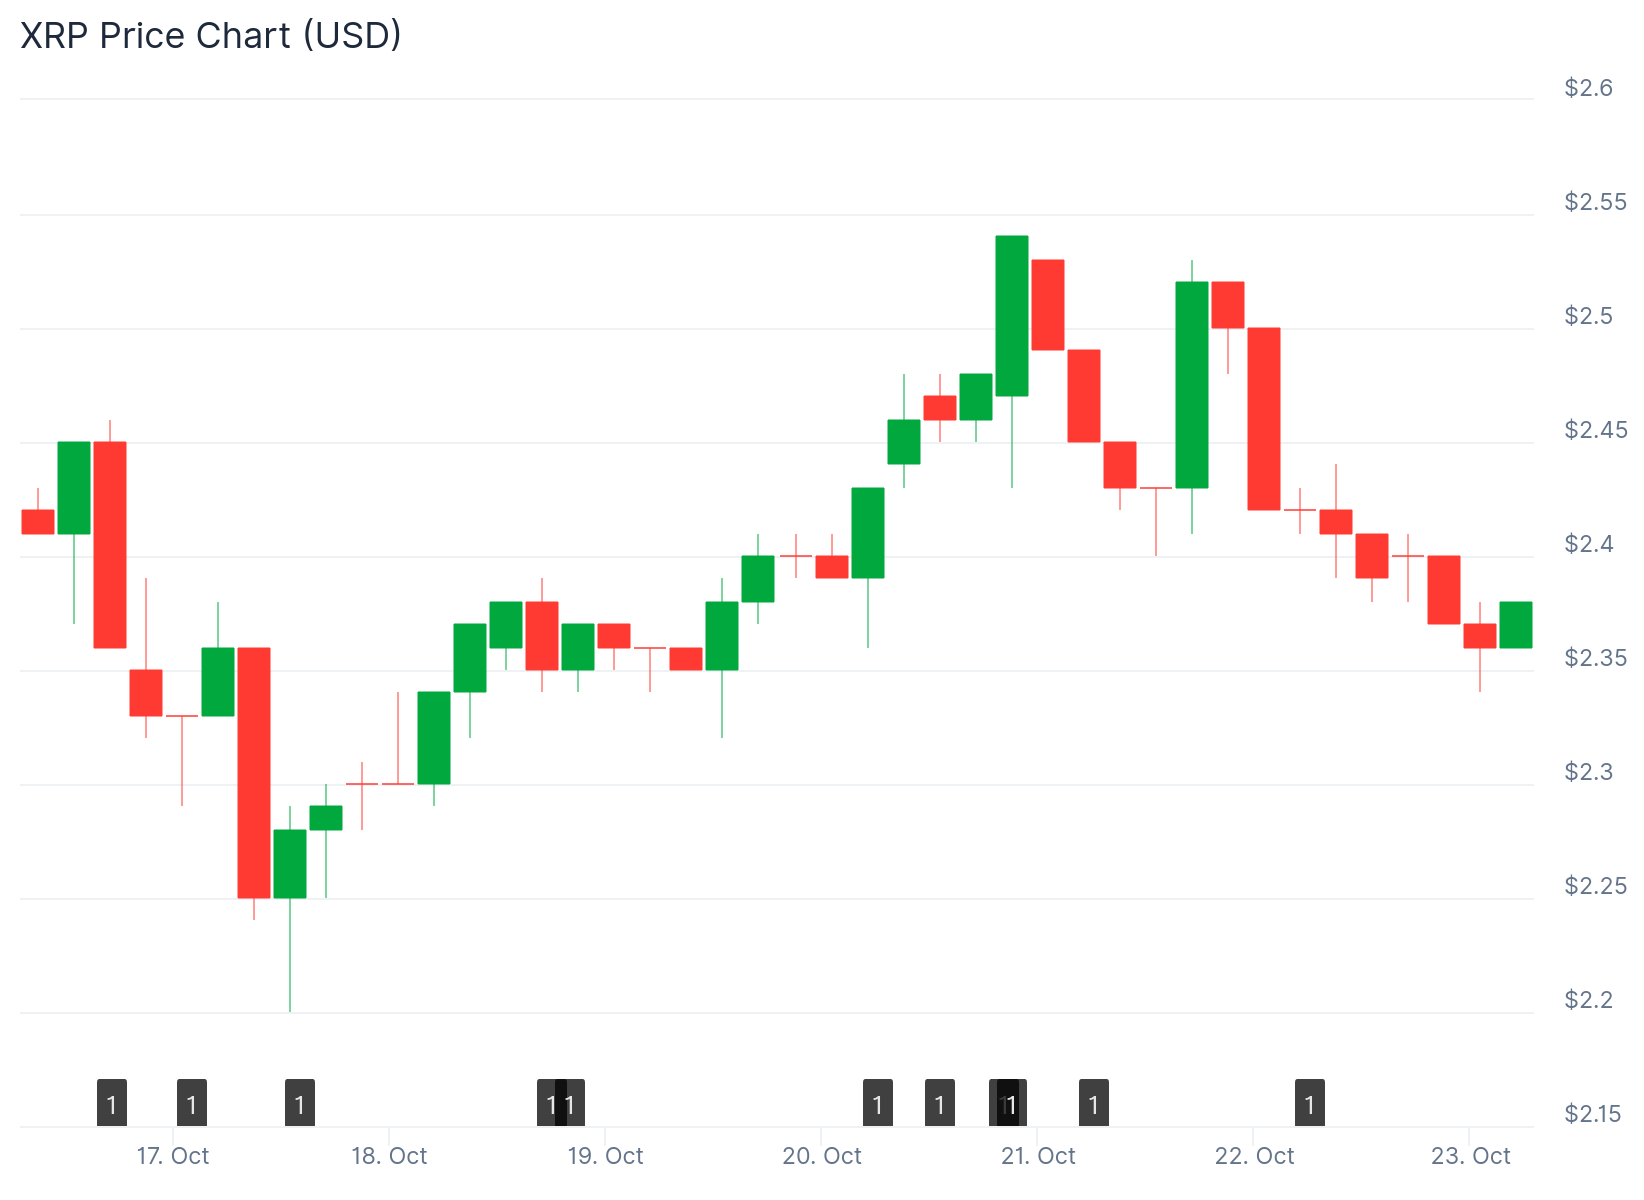
The token is currently trading below all moving averages. The bearish momentum has been consistent in recent sessions.
Despite the recent decline, technical analysis reveals a potentially bullish formation on the four-hour chart. The price action shows an inverse head-and-shoulders pattern taking shape
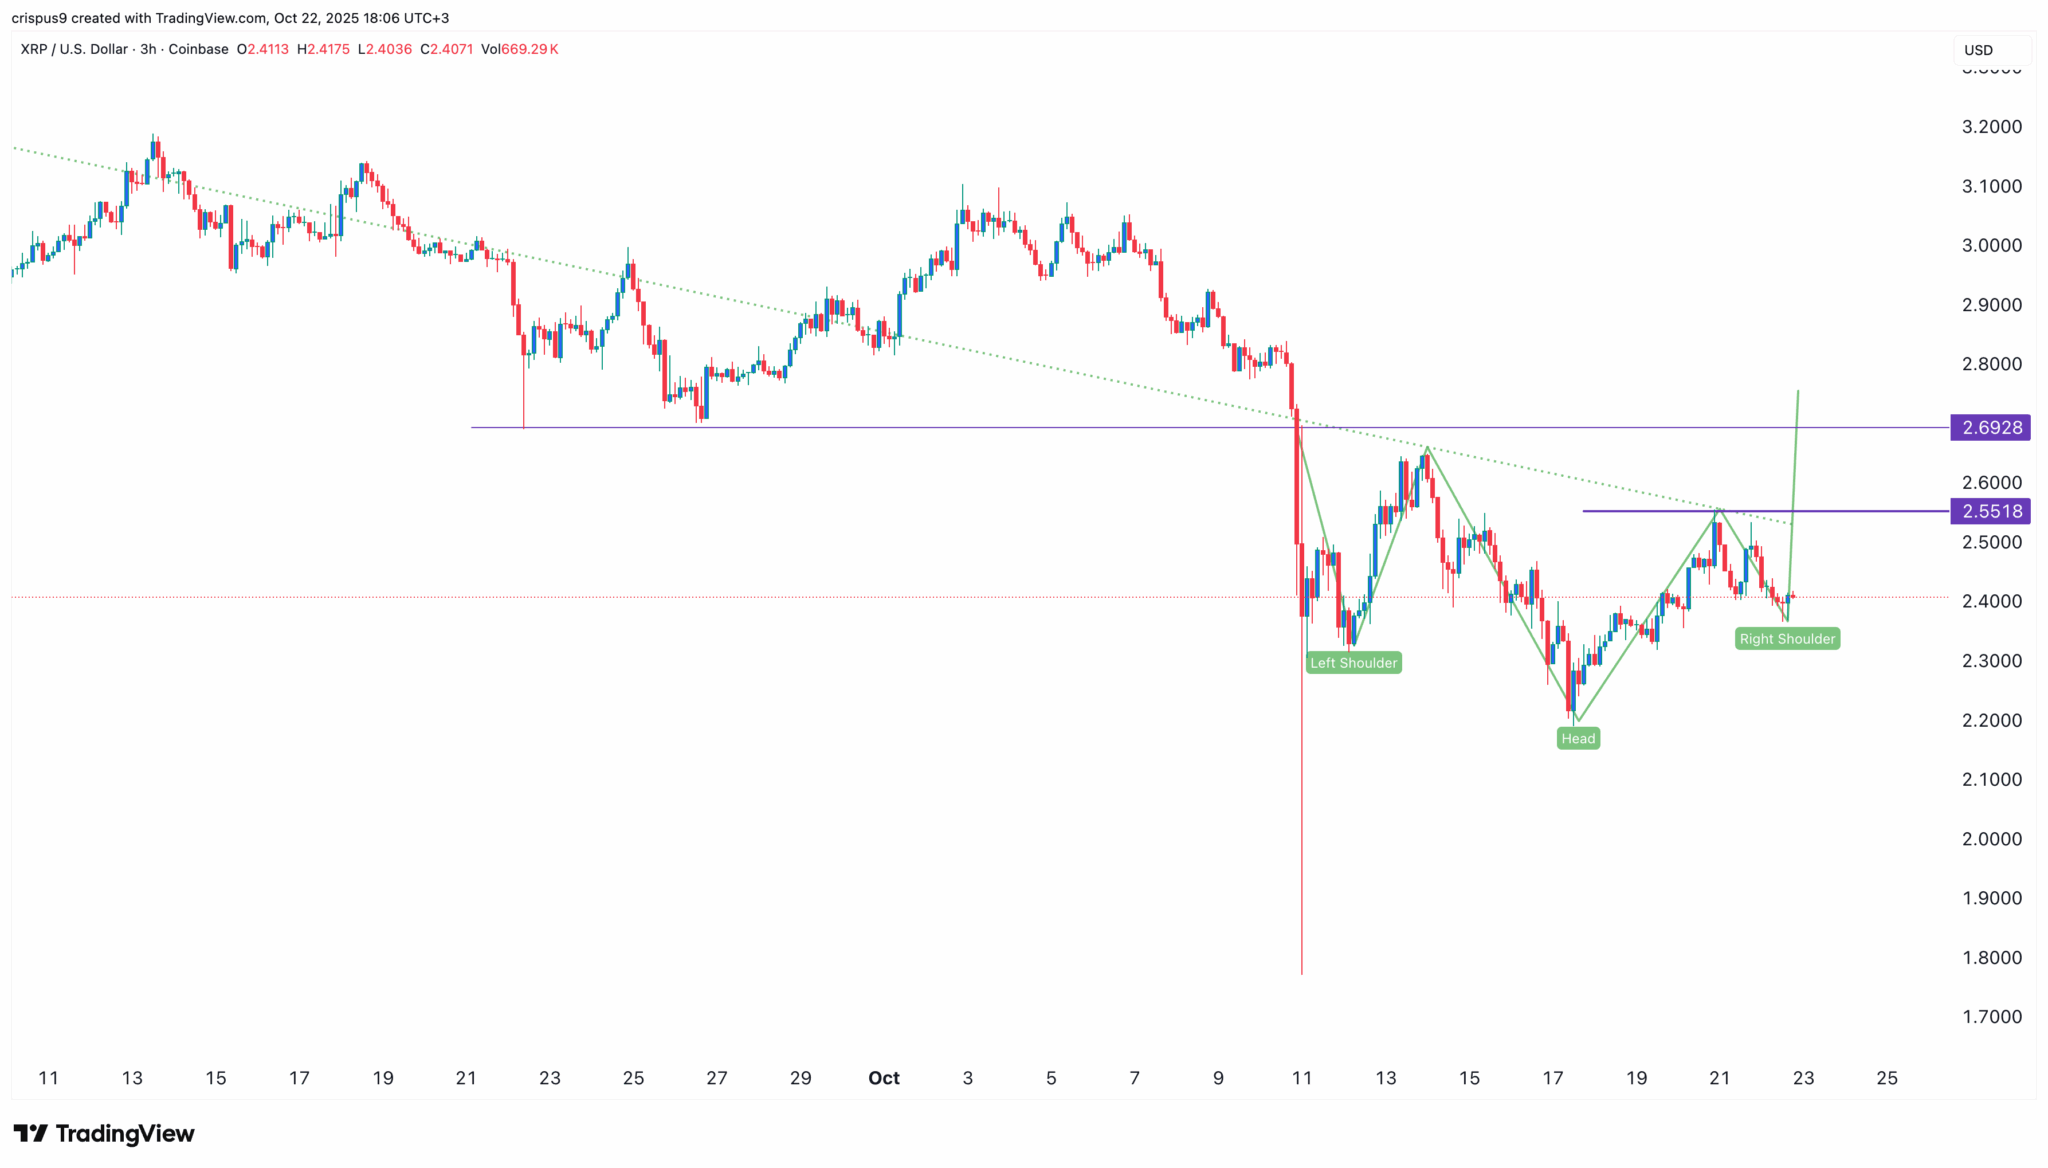
This classical pattern consists of three distinct parts. The head sits at $2.20, representing the lowest point of the formation.
The left shoulder formed at $2.32. The right shoulder is currently in development as traders watch price movements closely.
The pattern includes a slanted neckline connecting the highest swings since October 13. This neckline serves as a key resistance level for any potential breakout.
ETF Milestone Reached
The REX-Osprey XRP ETF (XRPR) has achieved a major milestone by surpassing $100 million in assets. The fund launched on September 18 and has seen steady growth.

Data from ETF.com indicates the fund has recorded inflows every single day since launch. These inflows continued even during the recent crypto market downturn.
The consistent demand from Wall Street investors demonstrates ongoing interest in XRP exposure. The fund’s performance may signal future success for other planned XRP ETFs.
Franklin Templeton and Bitwise have submitted applications for spot XRP ETFs. These products await approval from the Securities and Exchange Commission.
Stablecoin Growth Continues
The Ripple USD (RLUSD) stablecoin has reached $874 million in total assets. The stablecoin is approaching the $1 billion threshold.
This growth reflects increasing activity on the XRP Ledger network. More stablecoin adoption typically indicates higher network usage and transaction volume.
Technical Levels in Focus
If XRP breaks above the neckline, the price could reach $2.55. This level represents the highest point on October 20.
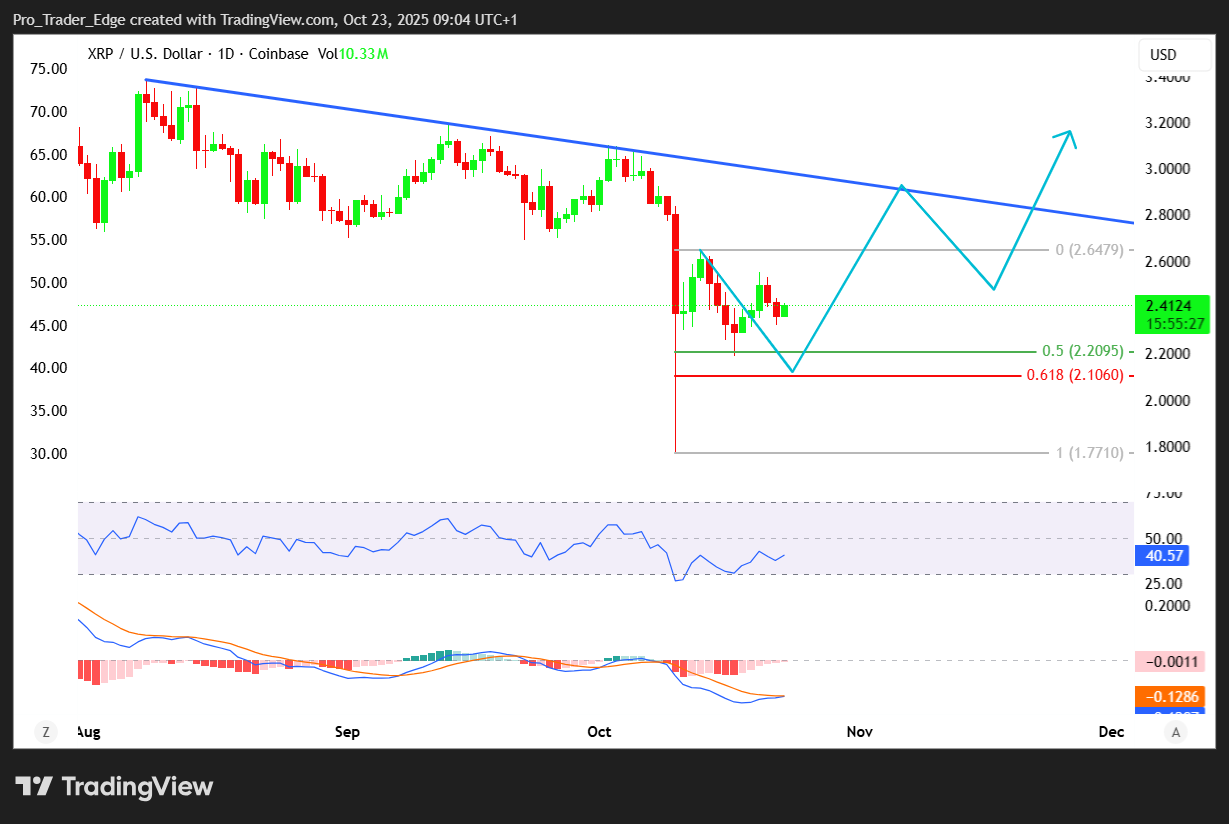
A move above $2.55 would open the path to $2.69. This target matches the lowest swing from September 22.
However, a drop below the left shoulder at $2.32 would cancel the bullish setup. Such a move could send the price down to the head level at $2.18.
The 100-hourly Simple Moving Average sits above the current price. This indicator is acting as resistance in the short term.
The MACD indicator shows momentum in the bearish zone. The RSI has fallen below the 50 level, indicating weak buying pressure.
Key support levels are located at $2.32 and $2.27. The main resistance zones sit at $2.42 and $2.50.
The price recently broke below a bullish trend line with support at $2.32. This break occurred on the hourly chart and added to the bearish pressure.
Bulls pushed the price above $2.50 during a recovery attempt from the $2.25 base. However, sellers became active near $2.55 and pushed the price back down.
The XRPR ETF has accumulated $100 million in assets within just over one month of trading.


