


 Price: Testing Lower Boundary of Long-Term Ascending Channel")


TLDR
- Dogecoin (DOGE) is trading around $0.19 and consolidating within an ascending channel pattern that dates back to 2021, showing higher highs and higher lows.
- The price is testing key resistance at $0.30 with strong support established between $0.15-$0.17, while technical indicators like MACD and RSI show positive momentum.
- Technical analysis shows DOGE is trading near the lower boundary of its long-term channel with Stochastic RSI at historical lows, similar to conditions before the 2021 rally.
- A breakout above $0.30 with strong volume could trigger a move toward $0.50, with some analysts projecting potential movement toward $1 if the bullish pattern continues.
- Major companies including Tesla and Newegg now accept Dogecoin as payment, adding real-world utility beyond its meme coin origins.
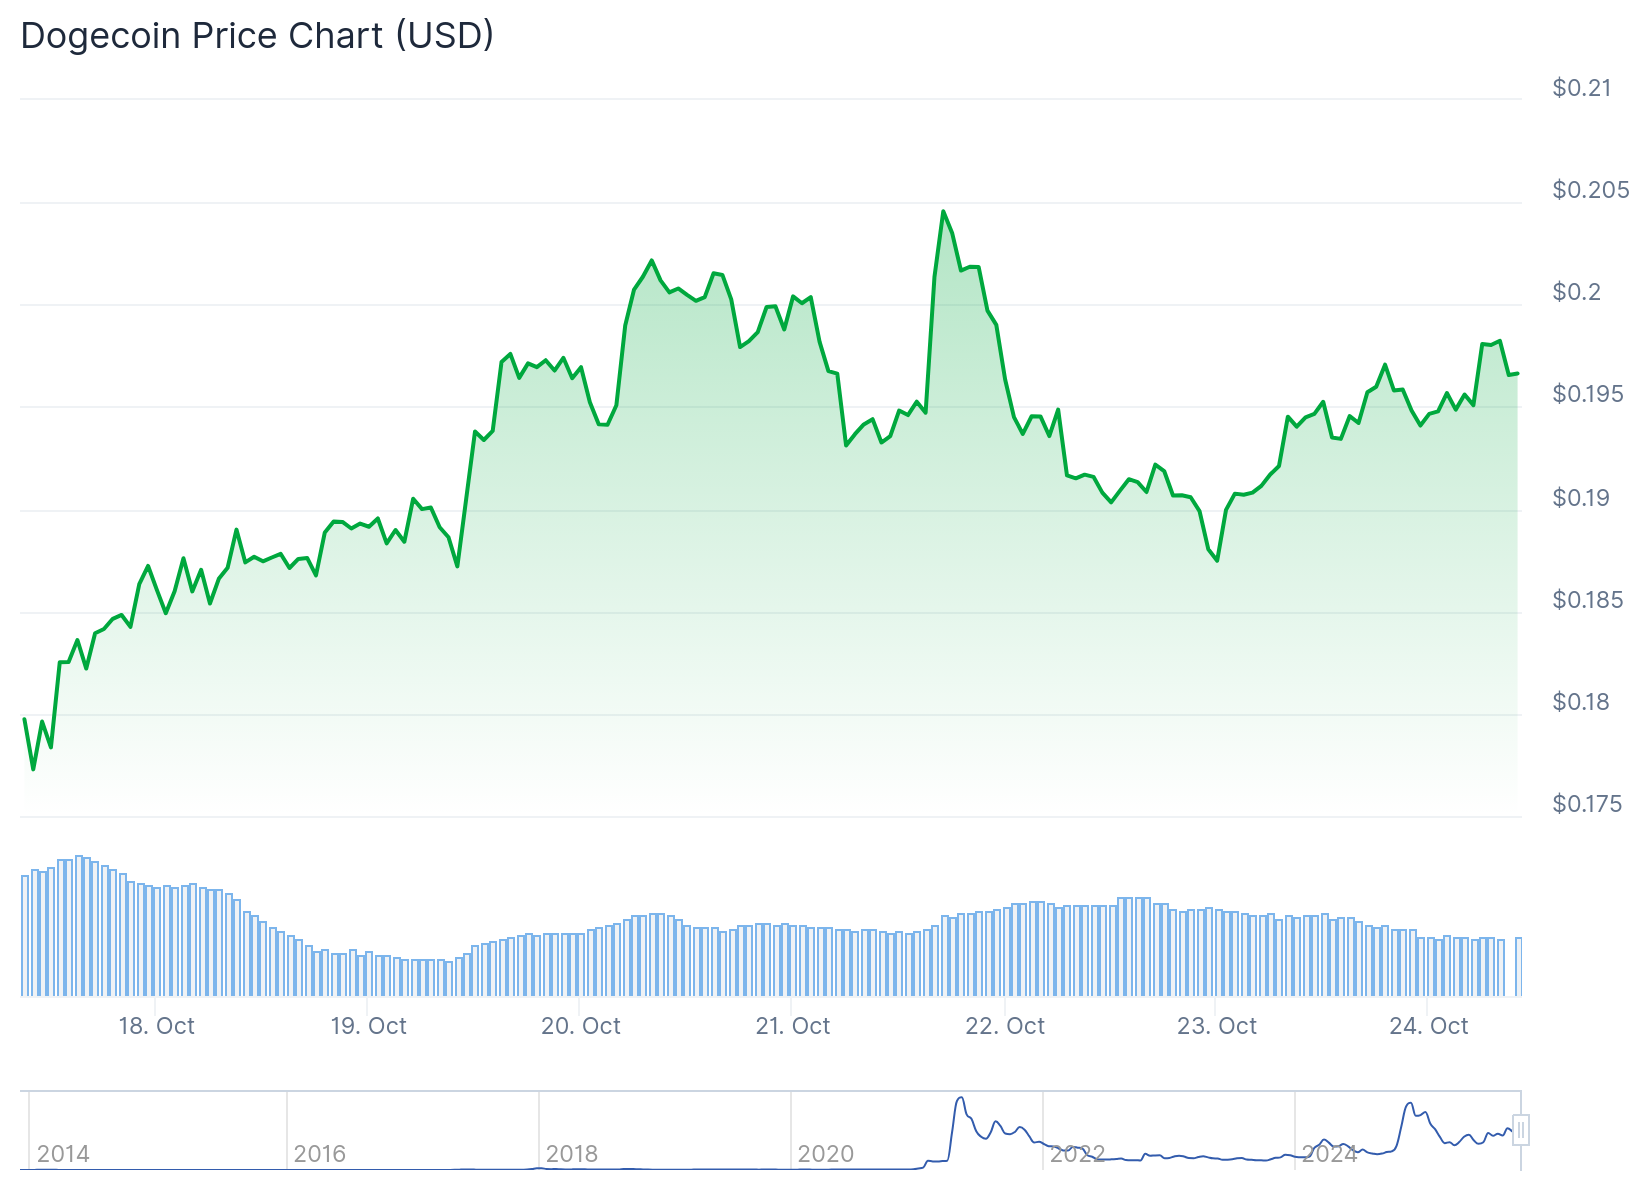
Dogecoin is currently trading around $0.19 after spending several days in a tight range. The meme coin has been moving between $0.18 and $0.20 with relatively quiet volatility across the broader market.
Technical analysis shows Dogecoin has been trading within an ascending channel since 2021. This pattern creates higher highs and higher lows, which typically indicates steady bullish momentum over time.
$DOGE get in before $1 pic.twitter.com/ZW3i5uRu8P
— Mikybull 🐂Crypto (@MikybullCrypto) October 23, 2025
The price is currently near the upper boundary of this range and testing resistance at $0.30. This level has rejected the price multiple times in recent months. Breaking through this barrier would be an important development for the token.
Support has formed between $0.15 and $0.17. The price has bounced off this area repeatedly, creating a floor that traders watch closely. If the price pulls back, this zone could provide a cushion.
Technical indicators including the MACD and RSI are showing favorable readings. These suggest the underlying momentum remains positive despite the tight trading range.
A recent flash crash earlier this month created a downward wick that bounced off the lower boundary of the ascending channel. This bounce occurred at a confluence of support levels right on the trendline.

Crypto analyst EtherNasyonaL posted analysis on social media platform X examining Dogecoin’s 3-month candlestick chart. The analysis shows the token trading at a historical bullish momentum low.
$DOGE momentum is at historical lows.
Dogecoin is in the lower band of the main ascending channel on the 3M chart and Stoch RSI is confirming the historical bottom zone
DOGE is currently in a phase of full strength recovery, quiet, calm, yet determined.
When the next movement… https://t.co/cyJNUSEQ0o pic.twitter.com/qph1jjw4fq
— EᴛʜᴇʀNᴀꜱʏᴏɴᴀL 💹🧲 (@EtherNasyonaL) October 22, 2025
Momentum Indicators at Historical Levels
The Stochastic RSI is confirming a bottoming phase similar to those seen before previous bull runs. This momentum oscillator tracks the rate of change and is currently at its lowest level. The indicator is even lower than before Dogecoin’s rally in 2021.
The analyst described this period as a phase of “quiet, calm, yet determined recovery.” This suggests the market may be gradually regaining strength beneath the surface.
The long-term structure shows a consistent pattern of Dogecoin bouncing back each time it reaches the lower band of its channel. Previous reversals at this level led to substantial rallies.
The current setup mirrors early stages of recovery seen before the 2021 breakout. During that period, Dogecoin moved from below $0.10 to above $0.70.
Real-World Developments
Several factors are supporting Dogecoin beyond technical analysis. The broader cryptocurrency market has been recovering with Bitcoin and major altcoins showing strength. Dogecoin tends to move with overall market sentiment.
Major companies now accept Dogecoin as payment. Tesla and Newegg are among the businesses that have integrated the token into their payment systems. This gives Dogecoin more legitimacy beyond its origins as a meme coin.
The Dogecoin community remains active and vocal. This continues to attract new investors and maintains interest during periods of consolidation.
A confirmed breakout above $0.30 with strong volume would likely trigger movement toward the $0.50 range. Traders are watching for volume spikes as the price approaches resistance levels.
Breakouts without strong volume often lead to false moves that quickly reverse. If buying pressure intensifies and Dogecoin can hold above $0.30 for multiple sessions, the odds of reaching higher targets would improve.
Channel Pattern and Price Targets
If Dogecoin follows its established pattern within the ascending channel, a rebound toward the midline would place the price around $0.50. A continued move upward could push the token into new territory above $0.90.
The positioning of the price within the ascending channel sets a technical foundation for another upward leg. The token is effectively at the lower range of its long-term structure.
If the support at $0.15 fails to hold, the current technical setup would need to be reassessed. As long as that floor remains intact and the ascending channel structure stays valid, the technical picture favors upward movement.
The next few weeks will be important for determining Dogecoin’s direction. Price action during this period will help confirm whether the technical setup plays out as anticipated.
At the time of recent reports, Dogecoin is trading at $0.1945, showing a 1.9% increase over a 24-hour period.


