


TLDR
- Sei (SEI) broke above a major descending trendline and is holding the $0.20 support level after weeks of decline.
- The token gained 4.4% in 24 hours and is trading at $0.2055 with a market cap of $1.27 billion.
- Technical indicators show the RSI recovering from oversold levels and the MACD histogram turning positive.
- Analysts identify potential resistance targets at $0.22, $0.27, $0.36, $0.52, and $0.74 if the bullish momentum continues.
- Price predictions for 2025 vary widely, ranging from $0.15 to $0.45 depending on market conditions.
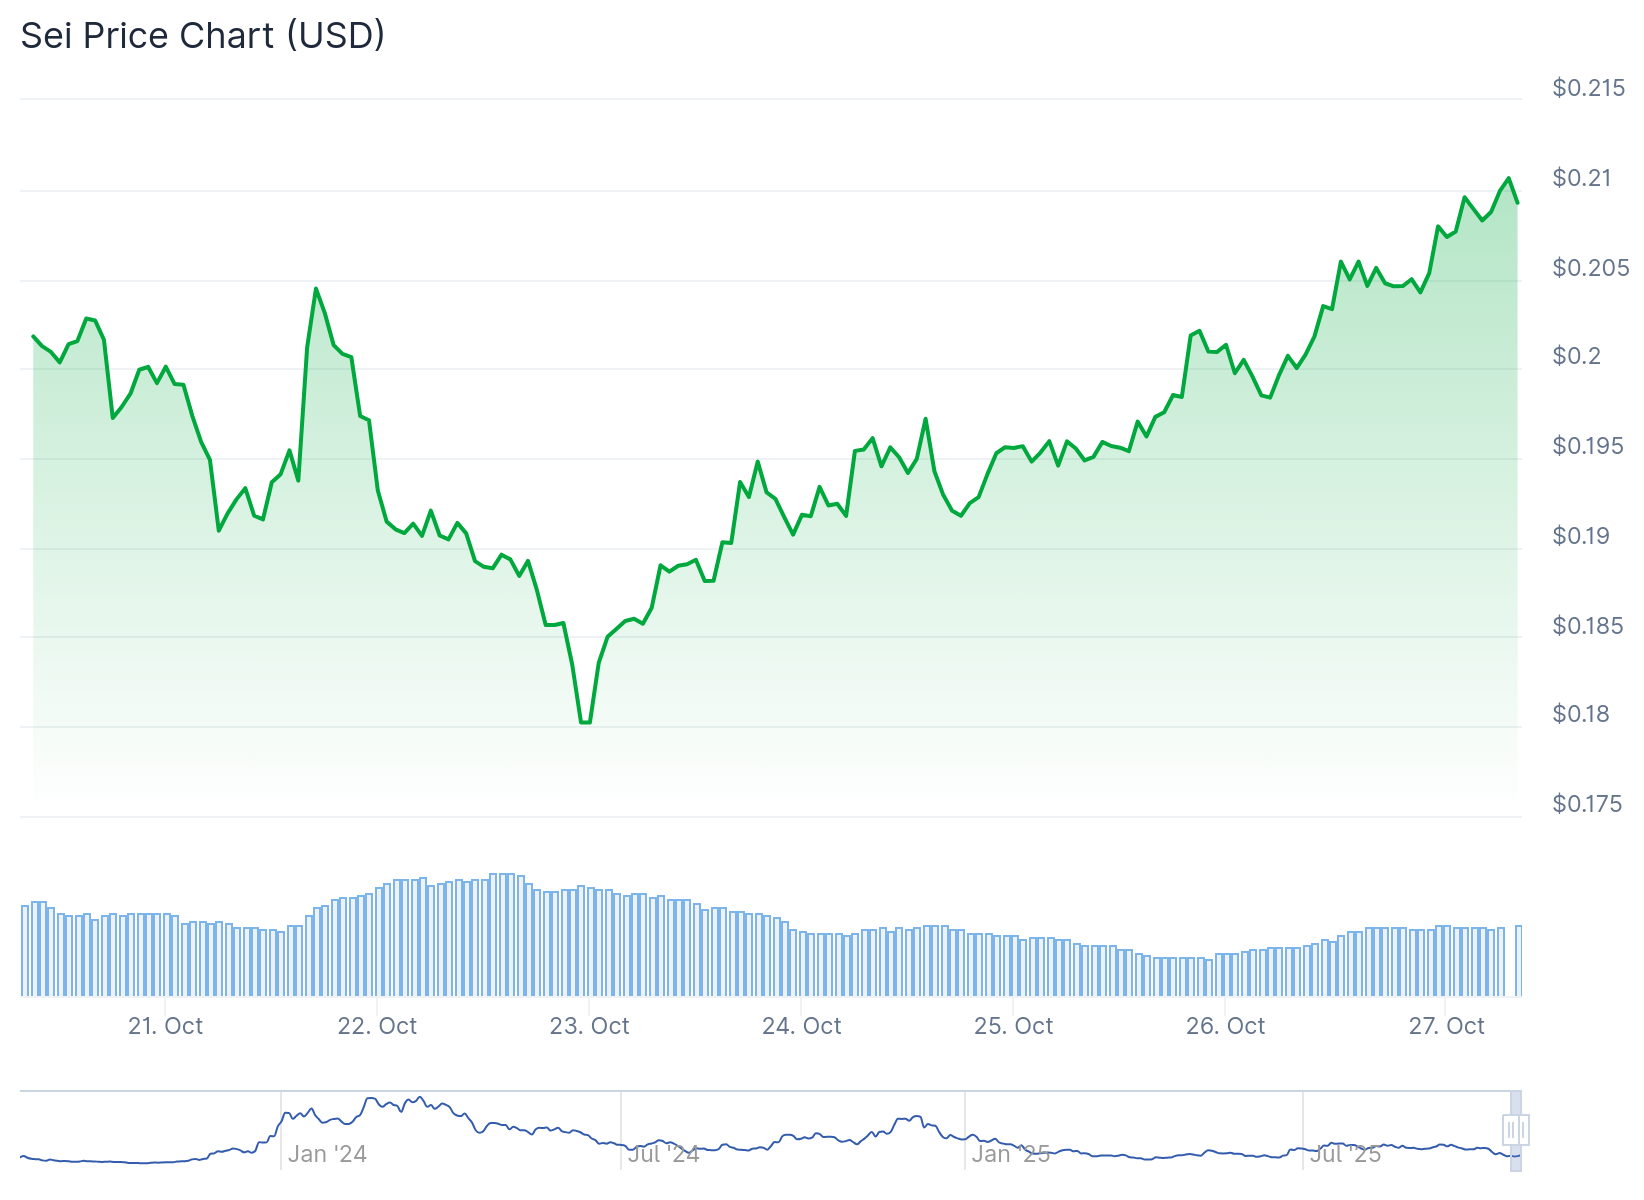
Sei is showing signs of recovery after breaking above a descending trendline that had pressured the token for several weeks. The cryptocurrency is now trading at $0.2055, marking a 4.4% gain over the past 24 hours.
The token’s market capitalization stands at $1.27 billion, ranking it 99th globally. Daily trading volume reached $87.42 million, representing a 46.61% increase from the previous day.
The available supply is 6.24 billion tokens. Over the past week, SEI posted a 5.63% increase, suggesting renewed interest from traders.
Technical analysis shared on social media shows SEI has broken above a major descending trendline. The token is consolidating above the $0.1800 support zone, which has served as a demand area in recent trading sessions.
$SEI just broke out of a falling wedge. Eyes on $0.22 next! https://t.co/GgickoYtDh pic.twitter.com/eFoT4ETq7w
— Ali (@ali_charts) October 26, 2025
Analysts note that maintaining this base could allow the asset to test higher resistance levels. The first targets include $0.2106 and $0.2285, with potential extension toward $0.2400 to $0.2503 if buying pressure continues.
The price chart shows SEI forming higher lows after a steep decline earlier in October. This pattern typically indicates a potential reversal from bearish to bullish sentiment.

Technical Indicators Point to Recovery
The Relative Strength Index currently sits at 39.33, recovering from oversold conditions. The RSI has crossed above its moving average at 33.63, indicating weakening bearish momentum.
However, the RSI remains below the neutral 50 mark. For a confirmed recovery trend, the indicator would need to climb above this level alongside rising daily closes.
The MACD indicator shows the MACD line at -0.0224 approaching a crossover above the signal line. The histogram has turned slightly positive at 0.0018, suggesting momentum may be shifting in favor of buyers.
Analyst Targets and Price Projections
Crypto analyst Profit Demon identified a descending channel pattern on the three-day chart. This formation often precedes a breakout phase.
The token has formed a descending channel on the 3-day timeframe🧐
The technical setup is preparing for strong bullish expansion👀
Momentum buildup could target $0.27, $0.36, $0.52, and $0.74🎯 pic.twitter.com/fmT8uXG2po
— Profit Demon (@profitdemon) October 25, 2025
The analyst projects resistance targets at $0.27, $0.36, $0.52, and $0.74 if the bullish cycle continues. Momentum indicators suggest an accumulation phase may be underway.
Price predictions for 2025 vary across different sources. DigitalCoinPrice forecasts the token could reach $0.45 by year-end, with expectations of stabilization between $0.40 and $0.45 in the medium term.
Changelly presents a more conservative outlook. Their technical analysis projects a minimum price of $0.154, a maximum of $0.177, and an average of $0.199 in 2025.
The token is currently consolidating between $0.19 and $0.20. Sustained trading above this range could open the path toward the $0.22 resistance level, while a breakdown below $0.19 may trigger renewed selling pressure.


