


 Price: Dips To $145 As Traders Eye Falling Wedge Breakout")


TLDR
- Solana (SOL) dropped below $165 and touched a low of $145 before recovering slightly to around $157
- The price is trading below the 100-hour simple moving average with resistance forming at $158
- SOL is down 31% for the month as the crypto market experienced over $2 billion in total liquidations
- Technical analysis shows a falling wedge pattern which often signals potential for a bullish reversal
- Key support level sits at $145-$150, while resistance levels are at $162 and $166
Solana has entered a fresh decline, falling below multiple support zones. The cryptocurrency dropped under $165 and $162 against the US Dollar.

The price touched a low of $145 before recovering to current levels around $157. This drop follows similar movements in Bitcoin and Ethereum.
SOL is now trading below the 100-hour simple moving average. The price broke through the $175 and $165 support levels before gaining bearish momentum below $160.
The recent sell-off occurred during a period of intense market volatility. Bitcoin fell to $98,000 before rebounding to approximately $102,000.
Total liquidations across the crypto market have exceeded $1.78 billion. This reflects the pressure sweeping through derivative markets.

Solana is down 31% for the month. The token has recovered slightly from its $145 low, bouncing back above the 23.6% Fibonacci retracement level.
Technical Pattern Emerges
A bearish trend line has formed on the hourly chart with resistance at $158. Immediate resistance sits near this level.

The next resistance zones are at $162 and $166. The main resistance could be the 50% Fibonacci retracement level near $166.
Technical indicators show the MACD gaining pace in the bearish zone. The RSI is below the 50 level.
Support and Resistance Levels
On the daily chart, SOL appears to be forming a falling wedge pattern. This technical setup typically signals selling exhaustion.
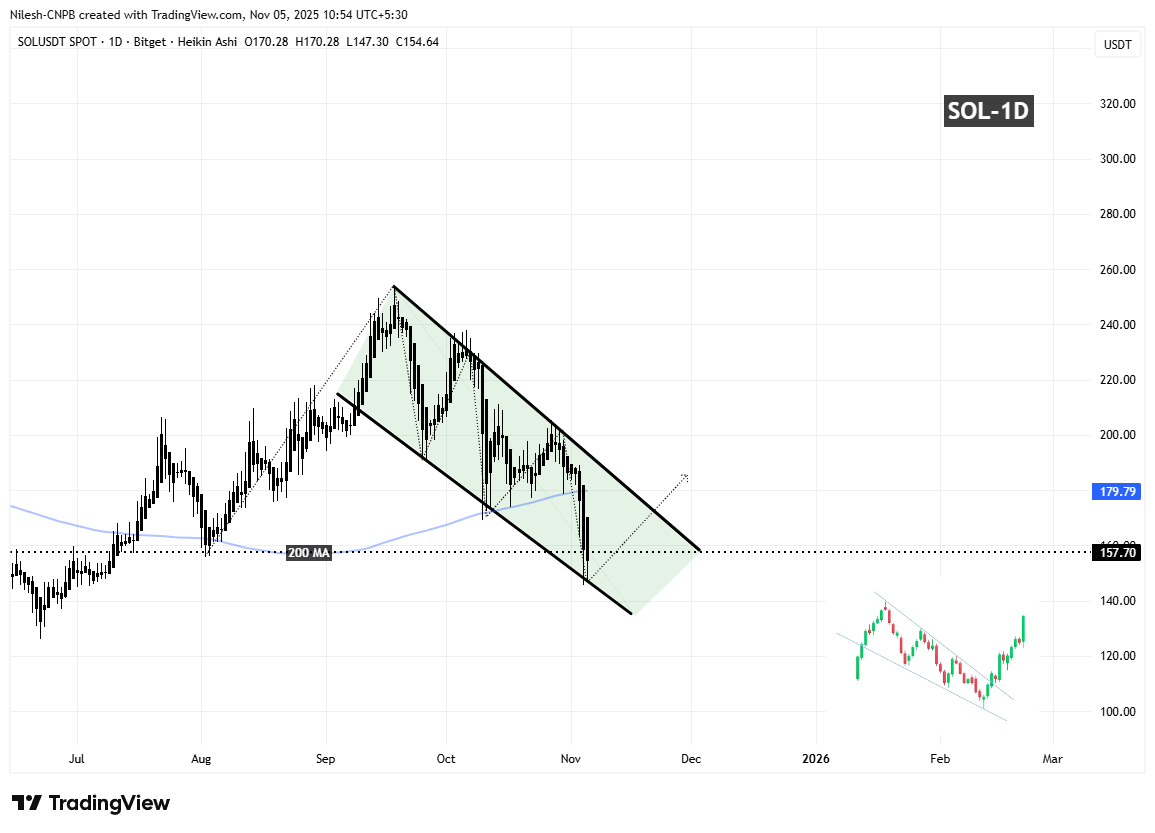
The lower boundary near $145.81 has acted as a solid support zone. Buyers are defending this level.
If the price holds above the wedge support trendline, traders may look for a move toward the upper boundary. A breakout above this resistance could drive the price toward the 200-day moving average near $179.79.
Initial support on the downside sits near $155. The first major support level is at $150.
A break below $150 could push the price toward $145. If SOL closes below $145, the next support zone would be $132.
For a recovery to begin, bulls need to push the price above $166. A successful close above this level could set up another steady increase with the next target at $175.
The current price action shows Solana consolidating around $157 after bouncing from the $145 low.


