


 Price: Drops to $2,067 After Losing $100 Billion in Market Cap")


TLDR
- Ethereum lost $100 billion in market capitalization over a seven-day period, dropping nearly 27% from $365 billion to $265 billion.
- ETH price fell to $2,107 on Wednesday, the lowest level since May 2025, and is currently trading at $2,095.
- Blackrock transferred $170 million in bitcoin and ethereum to Coinbase Prime, which historically signals potential institutional liquidations.
- Ethereum’s validator entry queue has surged to 71 days, showing strong staking demand despite the price decline.
- Technical indicators show ETH in oversold territory with the RSI below 30, while analysts identify key support between $2,100 and $2,200.
Ethereum experienced its sharpest decline of the year this week. The second-largest cryptocurrency lost $100 billion in market value over seven days.
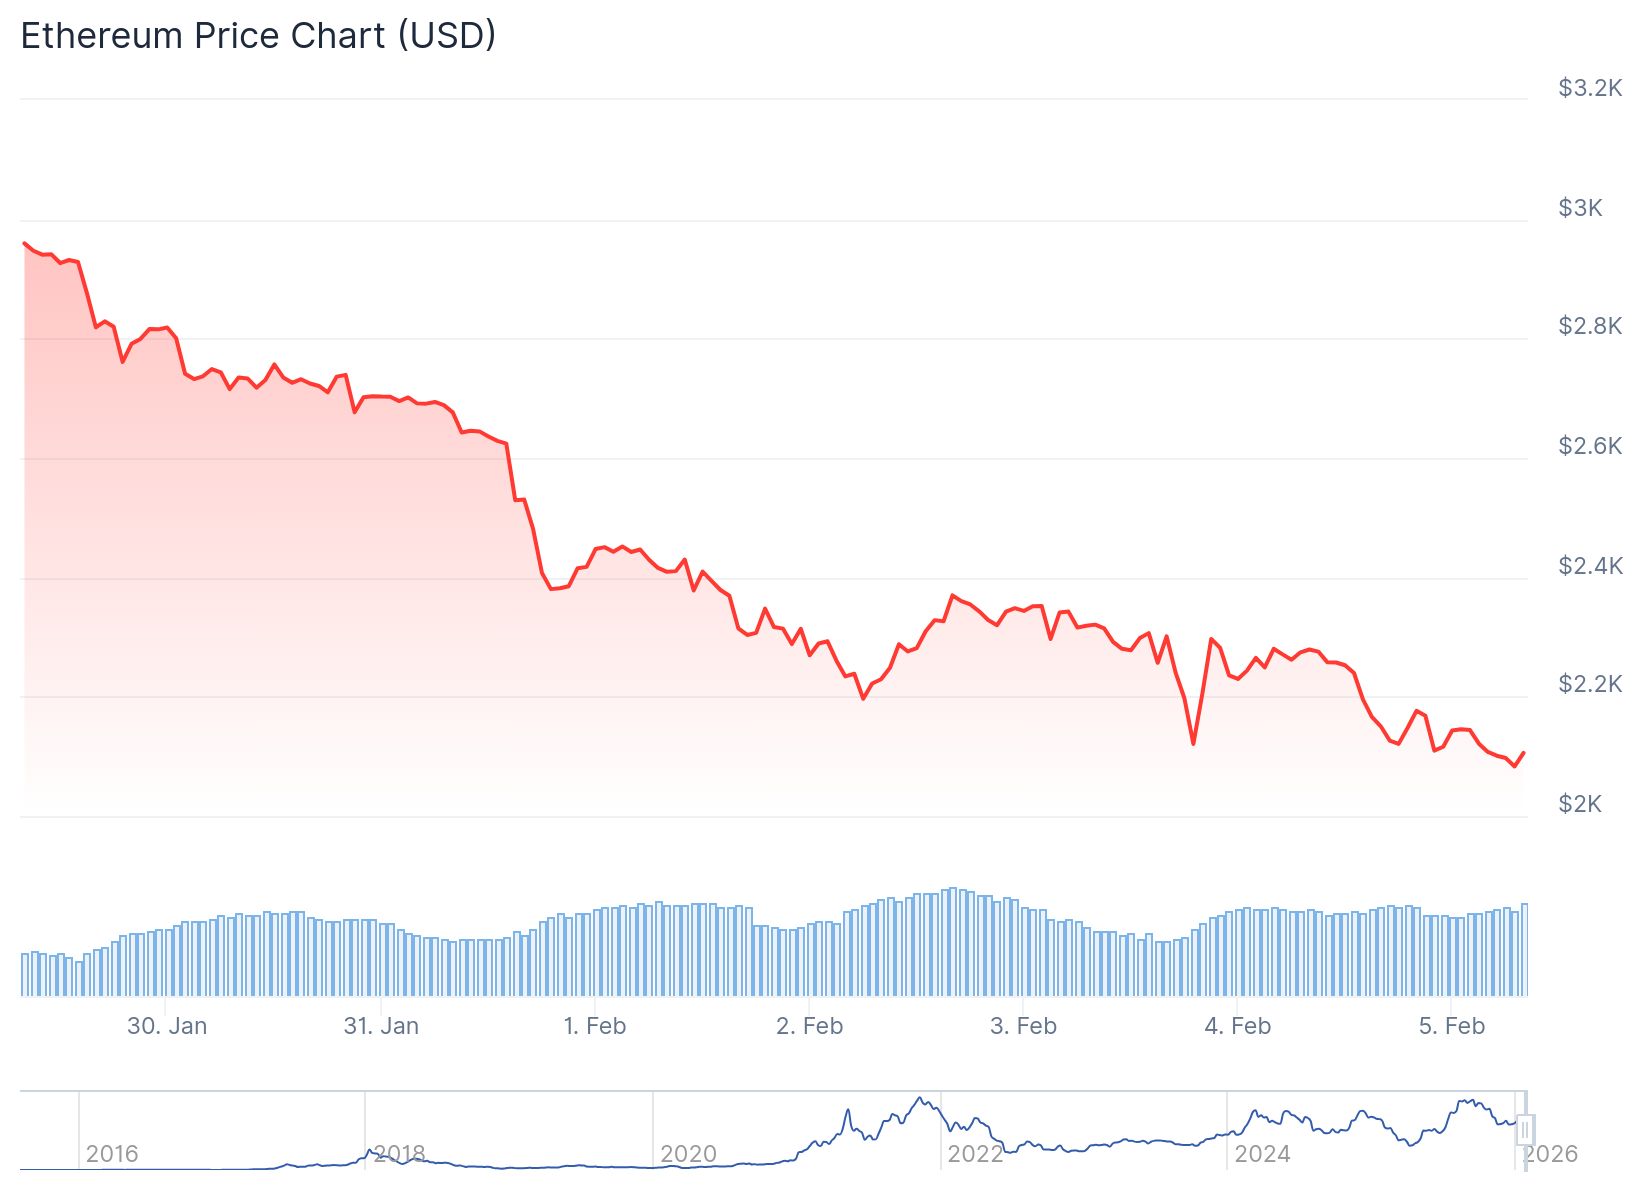
The price dropped from a $365 billion market cap on January 28 to $265 billion by February 4. This represents a weekly loss of nearly 27%.
ETH fell to $2,107 on Wednesday. This marked the lowest price point since May 2025. The cryptocurrency is currently trading at $2,095.
Ethereum emerged as the biggest loser among the top ten cryptocurrencies during this period. The decline outpaced losses seen in bitcoin and other major digital assets.
Reports indicated that Blackrock transferred $170 million in bitcoin and ethereum to Coinbase Prime. The asset manager is the world’s largest. Such transfers have historically preceded institutional liquidations.
This news appeared to trigger additional selling pressure from retail investors. Market participants viewed the transfer as a bearish signal.
Network Fundamentals Show Strength
Despite the price decline, on-chain metrics reveal different trends. Ethereum’s validator entry queue reached 71 days. This indicates strong demand for staking assets.

Analysis from Elfa AI suggests this supply-demand mismatch could support future price recovery. The backlog includes both institutional and individual stakers.
$ETH 8000$
Maybe I'm crazy but I still think that $ETH will reach 8000$.
We need one more last sweep at 2100 and after I'm expecting a bounce from there. pic.twitter.com/Xx36K9NYEm
— Crypto Million (@CryptoMillionYT) February 3, 2026
Investment firm Perennial continues to hold its ethereum position. The firm currently sits on $6 billion in unrealized losses from its 4.3 million ETH treasury. This represents a “diamond hands” approach from institutional holders.
The market value to realized value ratio shows ETH approaching a critical support zone. Analyst Ali Charts notes historical patterns suggest a cycle bottom may form near $1,959.
Pricing Bands also hint that Ethereum $ETH has room to explore lower levels.
Based on this model, a cycle bottom could form below $1,959. pic.twitter.com/qmG018xMIK
— Ali Charts (@alicharts) February 3, 2026
Technical Analysis Points to Downside Targets
Technical charts show ethereum completed an inverse cup-and-handle pattern breakdown. The neckline break occurred at $2,960. This level has now flipped from support to resistance.
Analysts identify a downside target of $1,665 based on this pattern. Immediate structural support sits between $2,100 and $2,200.
The relative strength index dropped below 30. This indicates oversold conditions. However, the RSI trendline continues to slope downward.
The moving average convergence divergence histogram is expanding in negative territory. The Chaikin money flow indicator remains deep in the red. These signals confirm selling volume still outpaces buying activity.
Ethereum is trading below $2,200 and the 100-hourly simple moving average. A bearish trend line has formed with resistance at $2,255.
The first key resistance level sits at $2,250. The next major resistance is near $2,390.
If ethereum fails to clear $2,250, initial support on the downside is near $2,100. The first major support sits at $2,075. A break below this level could push the price toward $2,050 or $2,000.
ETH dropped to $2,067 before recovering to its current price of $2,095.


