


 Price: BitMine Buys the Dip While Trend Research Exits Position")


TLDR
- Ethereum price moved back above $2,100 following large ETH transfers to Binance from Trend Research wallets
- Trend Research sold its remaining $44 million in ETH holdings, reporting a total loss of $750 million on the trade
- Exchange flow data showed volatile netflows with alternating periods of inflows and outflows matching price swings
- BitMine purchased another 20,000 ETH worth $41.98 million, bringing total holdings to 4.29 million ETH
- Chart analysis shows former support at $2,400 now acting as resistance with demand zones around $1,700-$1,400
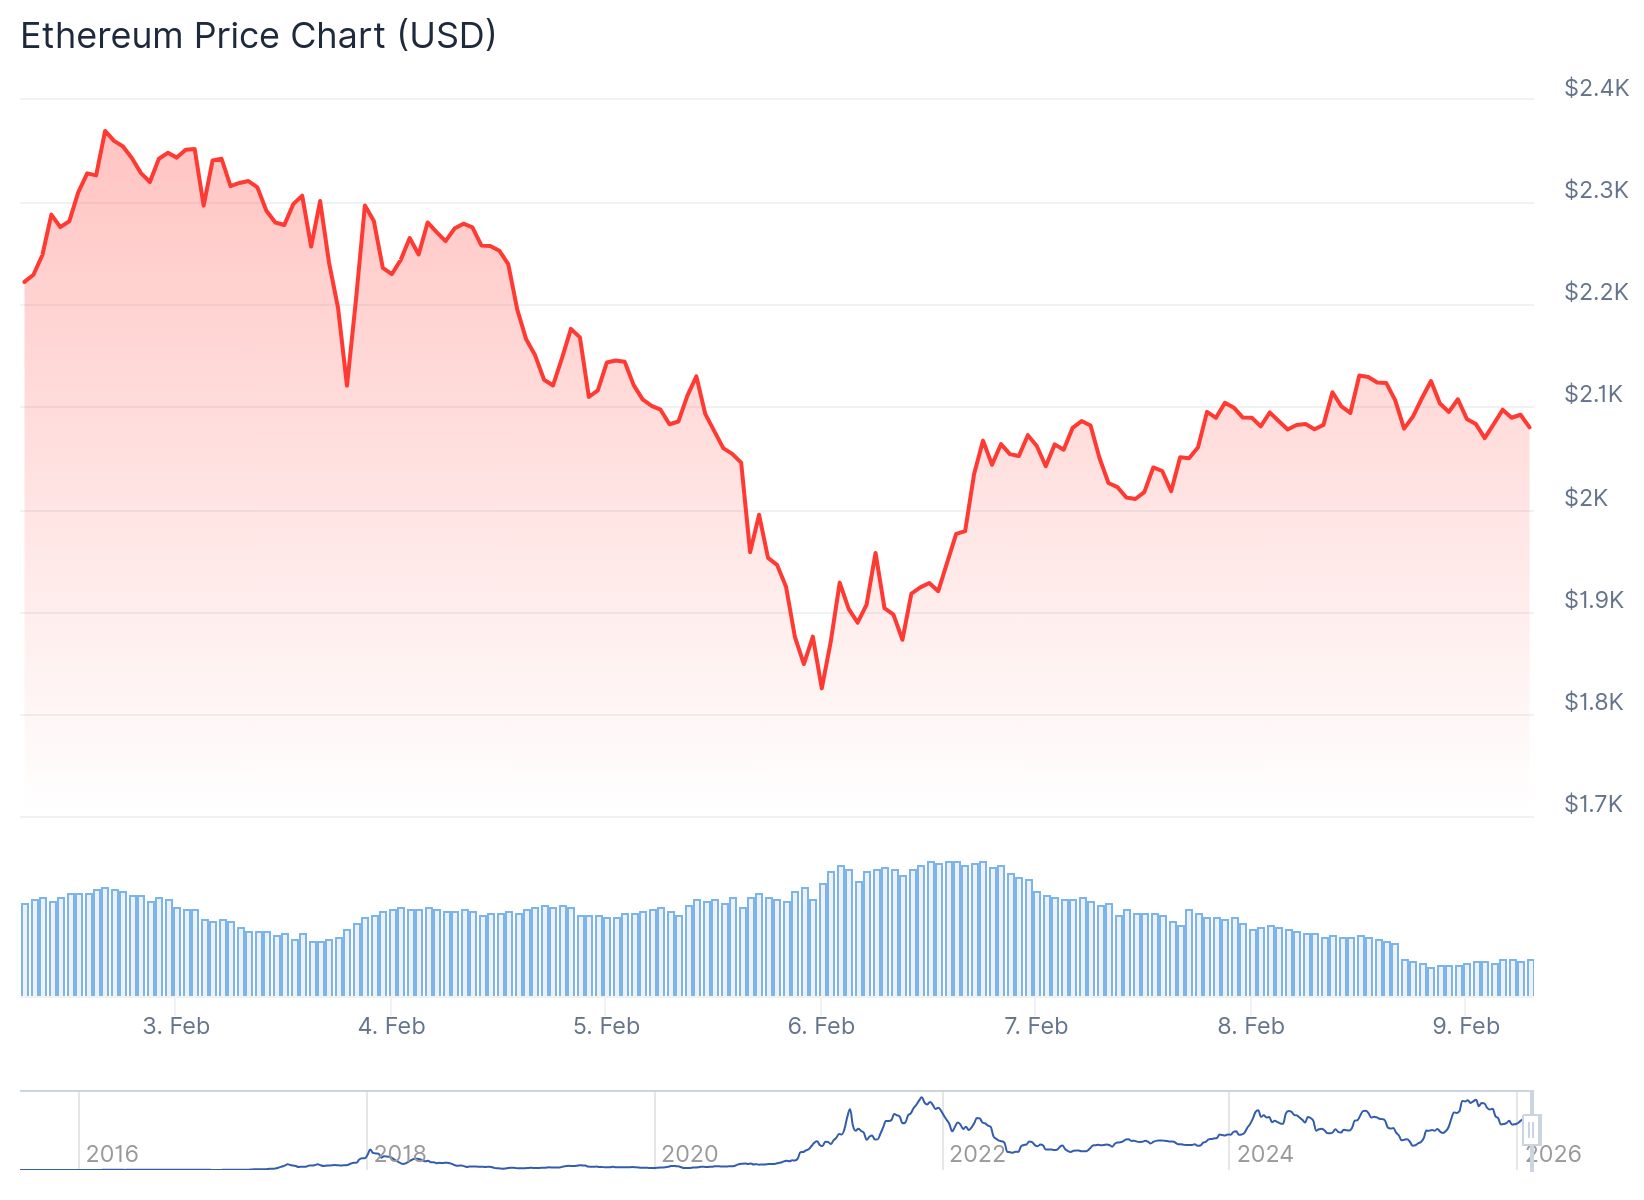
Ethereum price crossed the $2,100 threshold during recent trading sessions as on-chain activity showed large transfers to exchanges. The move came after several days of price volatility and shifting spot market conditions.
Data from blockchain analyst Ted Pillows revealed concentrated Ethereum transfers from Trend Research-linked wallets directly to Binance deposit addresses. The transactions occurred over approximately two days.
One transfer involved 11,000 ETH valued at $23.03 million. Another showed 9,770 ETH worth $20.55 million.
Trend Research has now sold $1,800,000,000 in $ETH this month.
They bought $2,600,000,000 in Ethereum and now hold only $43,000,000 in ETH.
Total loss: $796,000,000 pic.twitter.com/prVE1zkh3e
— Ted (@TedPillows) February 7, 2026
Additional deposits included 10,000 ETH valued at $20.48 million and 8,000 ETH worth $16.49 million. A separate transaction moved 11,919 ETH valued at $24.52 million.
The transactions originated from multiple Trend Research-labeled wallets. This pattern showed coordinated activity across several addresses.
Ted Pillows stated that Trend Research sold its remaining $44 million in ETH. The firm reported a total loss of $750 million on the Ethereum trade.

Price Structure and Technical Levels
The ETH/USDT Binance chart showed Ethereum trading below several former support zones. Price action failed to hold rebounds from late 2025 highs, forming lower highs into early 2026.
ETHEREUM JUST RECLAIMED A CRITICAL LEVEL.
$2,000 is the line that matters.
Price is back above it $2,022.Still early.
Not out of the woods yet.But as long as $ETH holds above $2K:
This is accumulation. Not distribution. pic.twitter.com/79Xxz2iio5— Merlijn The Trader (@MerlijnTrader) February 7, 2026
A breakdown occurred through a key support band near the mid-$2,400 area. This level previously acted as a consolidation zone.
The price continued to decline and crossed support around $2,100 before stabilizing. Chart markings showed former support areas becoming overhead resistance.
Below the current price, demand zones were highlighted around the high-$1,700 mark. A larger demand area stretched to the mid-$1,400s.
According to chart observations, a daily close above $2,100 could open the path toward the $2,400 region. Losing the $2,100 zone could expose ETH to another test of recent weekly lows.
BitMine Adds to Holdings
BitMine acquired approximately 20,000 ETH for $41.98 million on February 7. The purchase was reported by blockchain analysis platform Lookonchain using data from Arkham Intelligence.
Despite the market crash, Tom Lee(@fundstrat)'s #Bitmine bought another 20,000 $ETH($41.98M) 5 hours ago.https://t.co/r8hj4rmQeK pic.twitter.com/KFygmxx1aE
— Lookonchain (@lookonchain) February 8, 2026
This latest purchase moved BitMine closer to its goal of controlling 5% of Ethereum’s total circulating supply. Data from Strategic ETH Reserve showed the firm has achieved over 70% of that target with 4.29 million ETH holdings.
BitMine chairman Tom Lee defended the purchase strategy during a period of market weakness. Lee stated that Ethereum is the future of finance.
The company has been staking nearly 3 million ETH to generate yield. BitMine also made investments in smaller tokens like Orbs and media outlets.
Ethereum prices have dropped roughly 31% over the past 30 days, trading around $2,117 at press time. The asset traded as low as $1,824 over the past week, its lowest level since May 2025.
Exchange flow data reflected shifts in spot market behavior over a longer period. Spot flow records monitored alternating periods of net inflows and outflows alongside price action.
Past phases showed large outflows when prices were rising as Ethereum left exchanges. Increased inflows followed later when prices approached local highs.


