


 Price: Why ETF Money Keeps Coming Despite 44% Drop")


TLDR
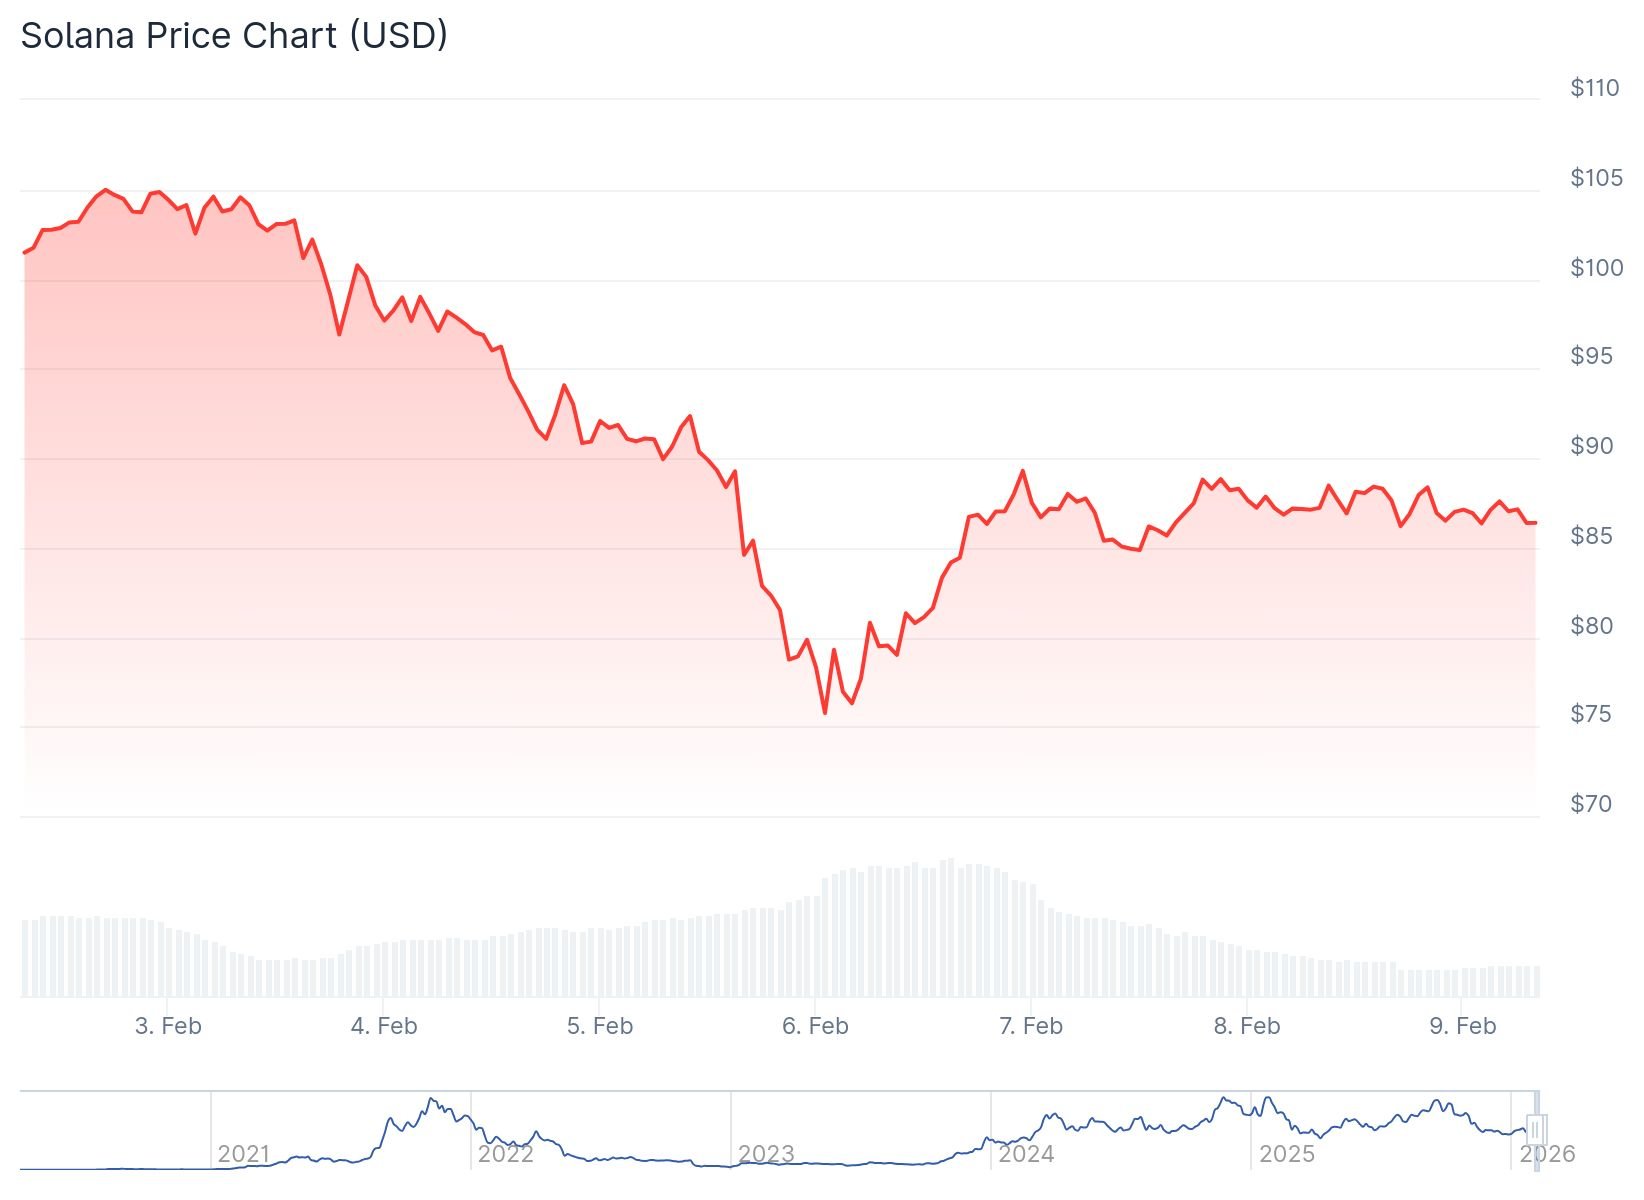
- Solana is trading below $90 after a Friday rebound of 11%, but the token has lost 14% over the past week and 44% over the last three months.
- Bitwise Solana Staking ETF attracted $1.48 million in new inflows on February 6, bringing total assets under management to $447 million.
- Open Interest in SOL futures dropped 2% to $5.32 billion, showing declining trader activity and reduced capital exposure.
- Funding rates remain negative at -0.0222, indicating short positions dominate as traders continue to bet against price recovery.
- Technical indicators show SOL trading below key moving averages with RSI at oversold levels, though bearish momentum may be fading.
Solana is trading below $90 on Monday, holding gains from Friday’s 11% rebound but still down 14% for the week. The layer-1 blockchain token has fallen 44% over the past three months as the broader crypto market remains under pressure.
Despite the price decline, institutional money continues flowing into Solana ETF products. The Bitwise Solana Staking ETF received $1.48 million in new inflows on February 6, bringing its total assets under management to $447 million. The inflow represents 0.33% of the fund’s total AUM.
Total net assets held by spot SOL ETFs reached $674 million this week. However, most US spot Solana ETFs recorded $11.86 million in outflows, excluding Fidelity’s FSOL which has not yet reported numbers.

The gap between ETF inflows and price performance shows a divide between long-term investors and short-term traders. ETF buyers appear to be using the price decline as an entry point for staking exposure.
On the derivatives side, market activity shows declining interest. SOL futures Open Interest dropped 2% over 24 hours to $5.32 billion, according to CoinGlass data. Lower Open Interest indicates reduced capital exposure as traders take a wait-and-see approach.
Derivatives Market Shows Bearish Stance
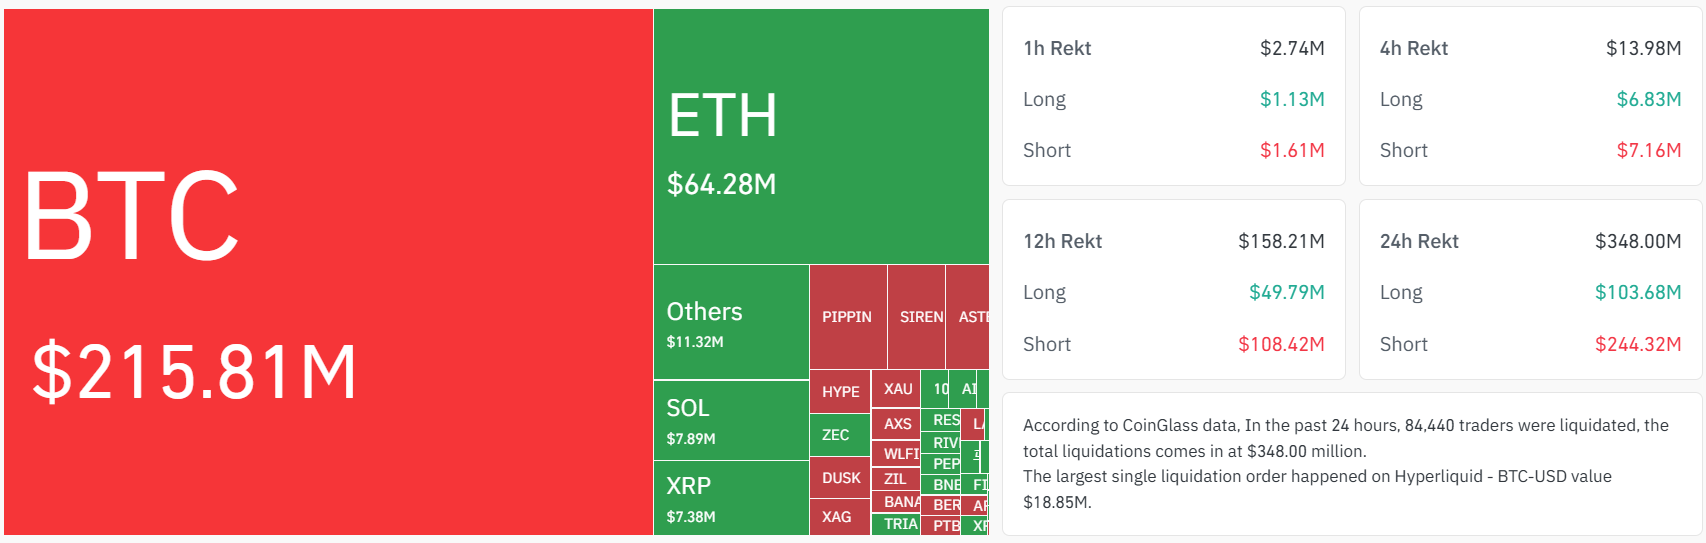
Total liquidations reached $8.38 million over the past 24 hours. Long positions saw $5.05 million liquidated while short positions faced $3.33 million in liquidations. Similar liquidation levels on both sides point to increased volatility.
Funding rates remain negative at -0.0222, meaning traders holding short positions are paying to maintain their bearish bets. This shows short positions continue to dominate the derivatives market.

Aggregated Open Interest sits at $2.34 billion, down from recent highs. The decline suggests traders are reducing leverage rather than adding new positions.
Technical Outlook Points to Continued Weakness
Solana is trading below both the 50-day and 200-day Exponential Moving Averages, confirming the bearish trend. Any price recoveries may face selling pressure at these moving average levels.
$SOL/weekly#Solana has made its final dip before a new cycle of bull run after a long consolidation 🔥 pic.twitter.com/UZOAnX2q8z
— Trader Tardigrade (@TATrader_Alan) February 8, 2026
The Moving Average Convergence Divergence indicator moved sideways after last week’s steep decline. The negative histogram is contracting, suggesting bearish pressure may be fading.
The Relative Strength Index stands at 29, placing SOL in oversold territory. This reading suggests a potential bounce could occur, though overall momentum remains weak.
On the price chart, Solana is compressed between $84.60 and $89.14 according to Bollinger Bands. The RSI reading is 51.16 while MACD histograms turned green in recent days.
Key resistance levels sit at $111 and $138, based on Fibonacci retracement levels from September’s $253 high to February’s $67 low. A daily close above $111 would improve the technical picture.
Support levels remain at $67 and a deeper zone at $51. The $51 level previously helped drive a bounce in November 2023.
The technical signal shows Strong Sell on the 1-day timeframe. SOL is currently trading at $87.77 as of press time.


