


 Price: Can Bulls Break $2,100 or Will Bear Pennant Send ETH to $1,200?")


TLDR
- Ethereum trades around $2,075 after rebounding from a recent selloff, with resistance between $2,106 and $2,166
- A whale moved 261,024 ETH worth $543 million to Binance, raising concerns about potential sell pressure
- Technical charts show a bear pennant pattern that could target $1,200 if support near $1,950 breaks
- Ethereum spot ETF flows remain negative over the past 90 days, showing weak institutional demand
- Price needs to close above $2,110 on the weekly chart to support a potential breakout higher
Ethereum is testing key resistance levels near $2,100 as the cryptocurrency consolidates after a sharp rebound from recent lows. The second-largest cryptocurrency faces multiple technical and market headwinds that could shape its near-term direction.
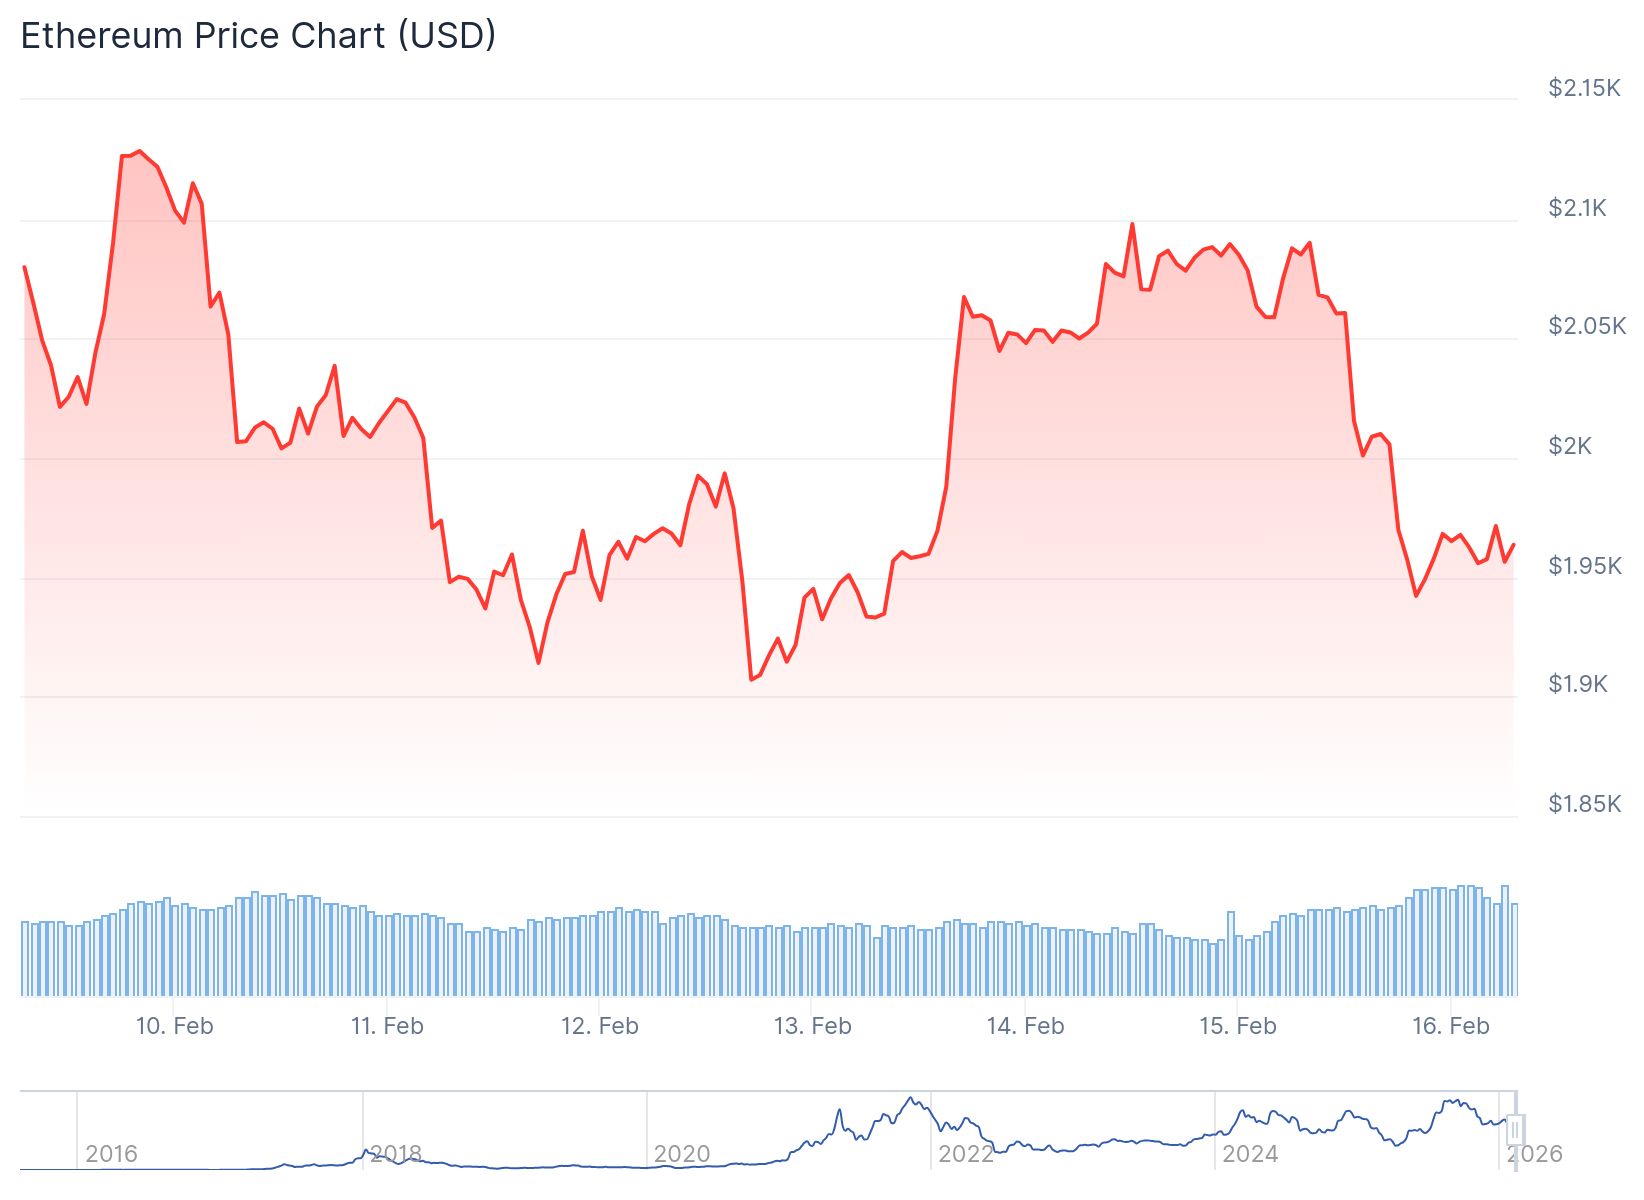
ETH currently trades around $2,075 on major exchanges. The price has recovered from a selloff that pushed it down to the $1,850 to $1,900 range. However, bulls now face a clear resistance zone between $2,106 and $2,166 that has rejected multiple attempts to break higher.
Charts show that Ethereum printed a rounded top inside this zone earlier in the month before sliding lower. The market has treated this area as the critical level to clear before any sustained recovery can take hold.
Analyst Daan Crypto Trades noted that ETH is consolidating against resistance after the recent decline. He said the cryptocurrency needs daily closes above this overhead region to support a breakout scenario.
$ETH Consolidating beneath the big $2.1K level.
Technically a higher low is made here. It's up to the bulls to get back above the region right above and hold there.
Would at least want to see some daily closes above that point to consider this a proper breakout. In that case we… https://t.co/NMXVaGLHMC pic.twitter.com/gT7e2Bp0e6
— Daan Crypto Trades (@DaanCrypto) February 14, 2026
Another trader pointed to the importance of the weekly close. A close above $2,110 would support a long setup on the chart. Failure to reclaim that level keeps downside risk in play for the cryptocurrency.
The recent price action has formed a higher low after the earlier drop. The rebound accelerated on February 14. However, the consolidation under resistance suggests bulls have not yet regained full control of the market.

Technical Pattern Points to Lower Targets
A bear pennant pattern has formed on Ethereum’s daily chart. The pattern developed after ETH fell from above $2,800 to the $1,900-$2,000 area in early February. This sharp drop created the flagpole portion of the pattern.
$ETH 1H Analysis 🧵
Massive displacement to the downside.
Now forming a rising wedge / bear flag under 2K.Liquidity building above… but structure still bearish.
If this breaks down →
🎯 1,788 first target
🎯 1,687 if momentum expandsWait for confirmation.#ETH #Ethereum pic.twitter.com/qxZnGnLoWt
— Anish Sharma (@Anish_Sharmaaa) February 16, 2026
Since then, price has compressed into a narrowing triangle with lower highs and slightly higher lows. Bear pennants typically break in the direction of the prior trend.
The cryptocurrency remains below its 50-day and 200-day moving averages. These technical indicators now act as overhead resistance. The RSI has bounced from lows but stays below the neutral 50 level.
A breakdown below pennant support near $1,950 would confirm bearish continuation. The measured move from the flagpole projects a target near $1,200. This represents roughly 40% downside from current levels.
The pattern would invalidate if ETH breaks above pennant resistance and holds those gains.
Large Whale Transfer Raises Questions
On-chain data shows wallets labeled as belonging to Garrett Jin deposited 261,024 ETH to Binance. The transfers totaled approximately $543 million and occurred in several large tranches.
Arkham Intelligence tracked the movement but notes that labels do not confirm real-world identity. The platform flags these addresses as belonging to the same entity based on behavioral patterns.
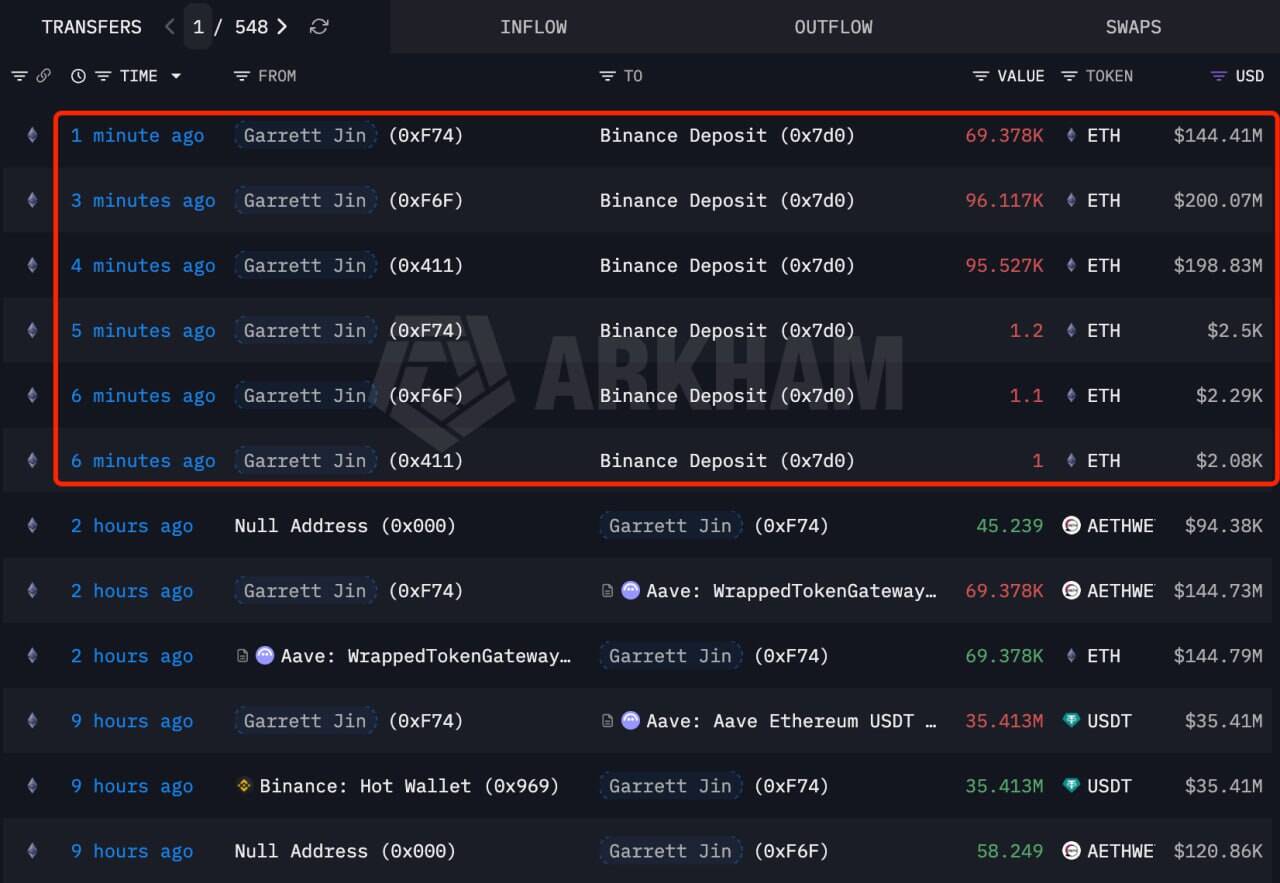
Transfers of this size to centralized exchanges typically raise concerns about potential selling. The moves bring large amounts of supply closer to spot market liquidity. However, deposits do not guarantee immediate selling activity.
Traders will monitor whether the deposited ETH distributes across exchange wallets or remains idle. Visible sell-side activity would add pressure to the already bearish chart structure. A lack of follow-through could limit downside and potentially trigger short-covering if positioning becomes too one-sided.
ETF Flows Show Weak Demand
Ethereum spot ETF flows add another bearish element to the current setup. Glassnode data shows the 30-day moving average of net flows has been negative for most of the past 90 days. Little evidence exists of a turn higher in these flows.
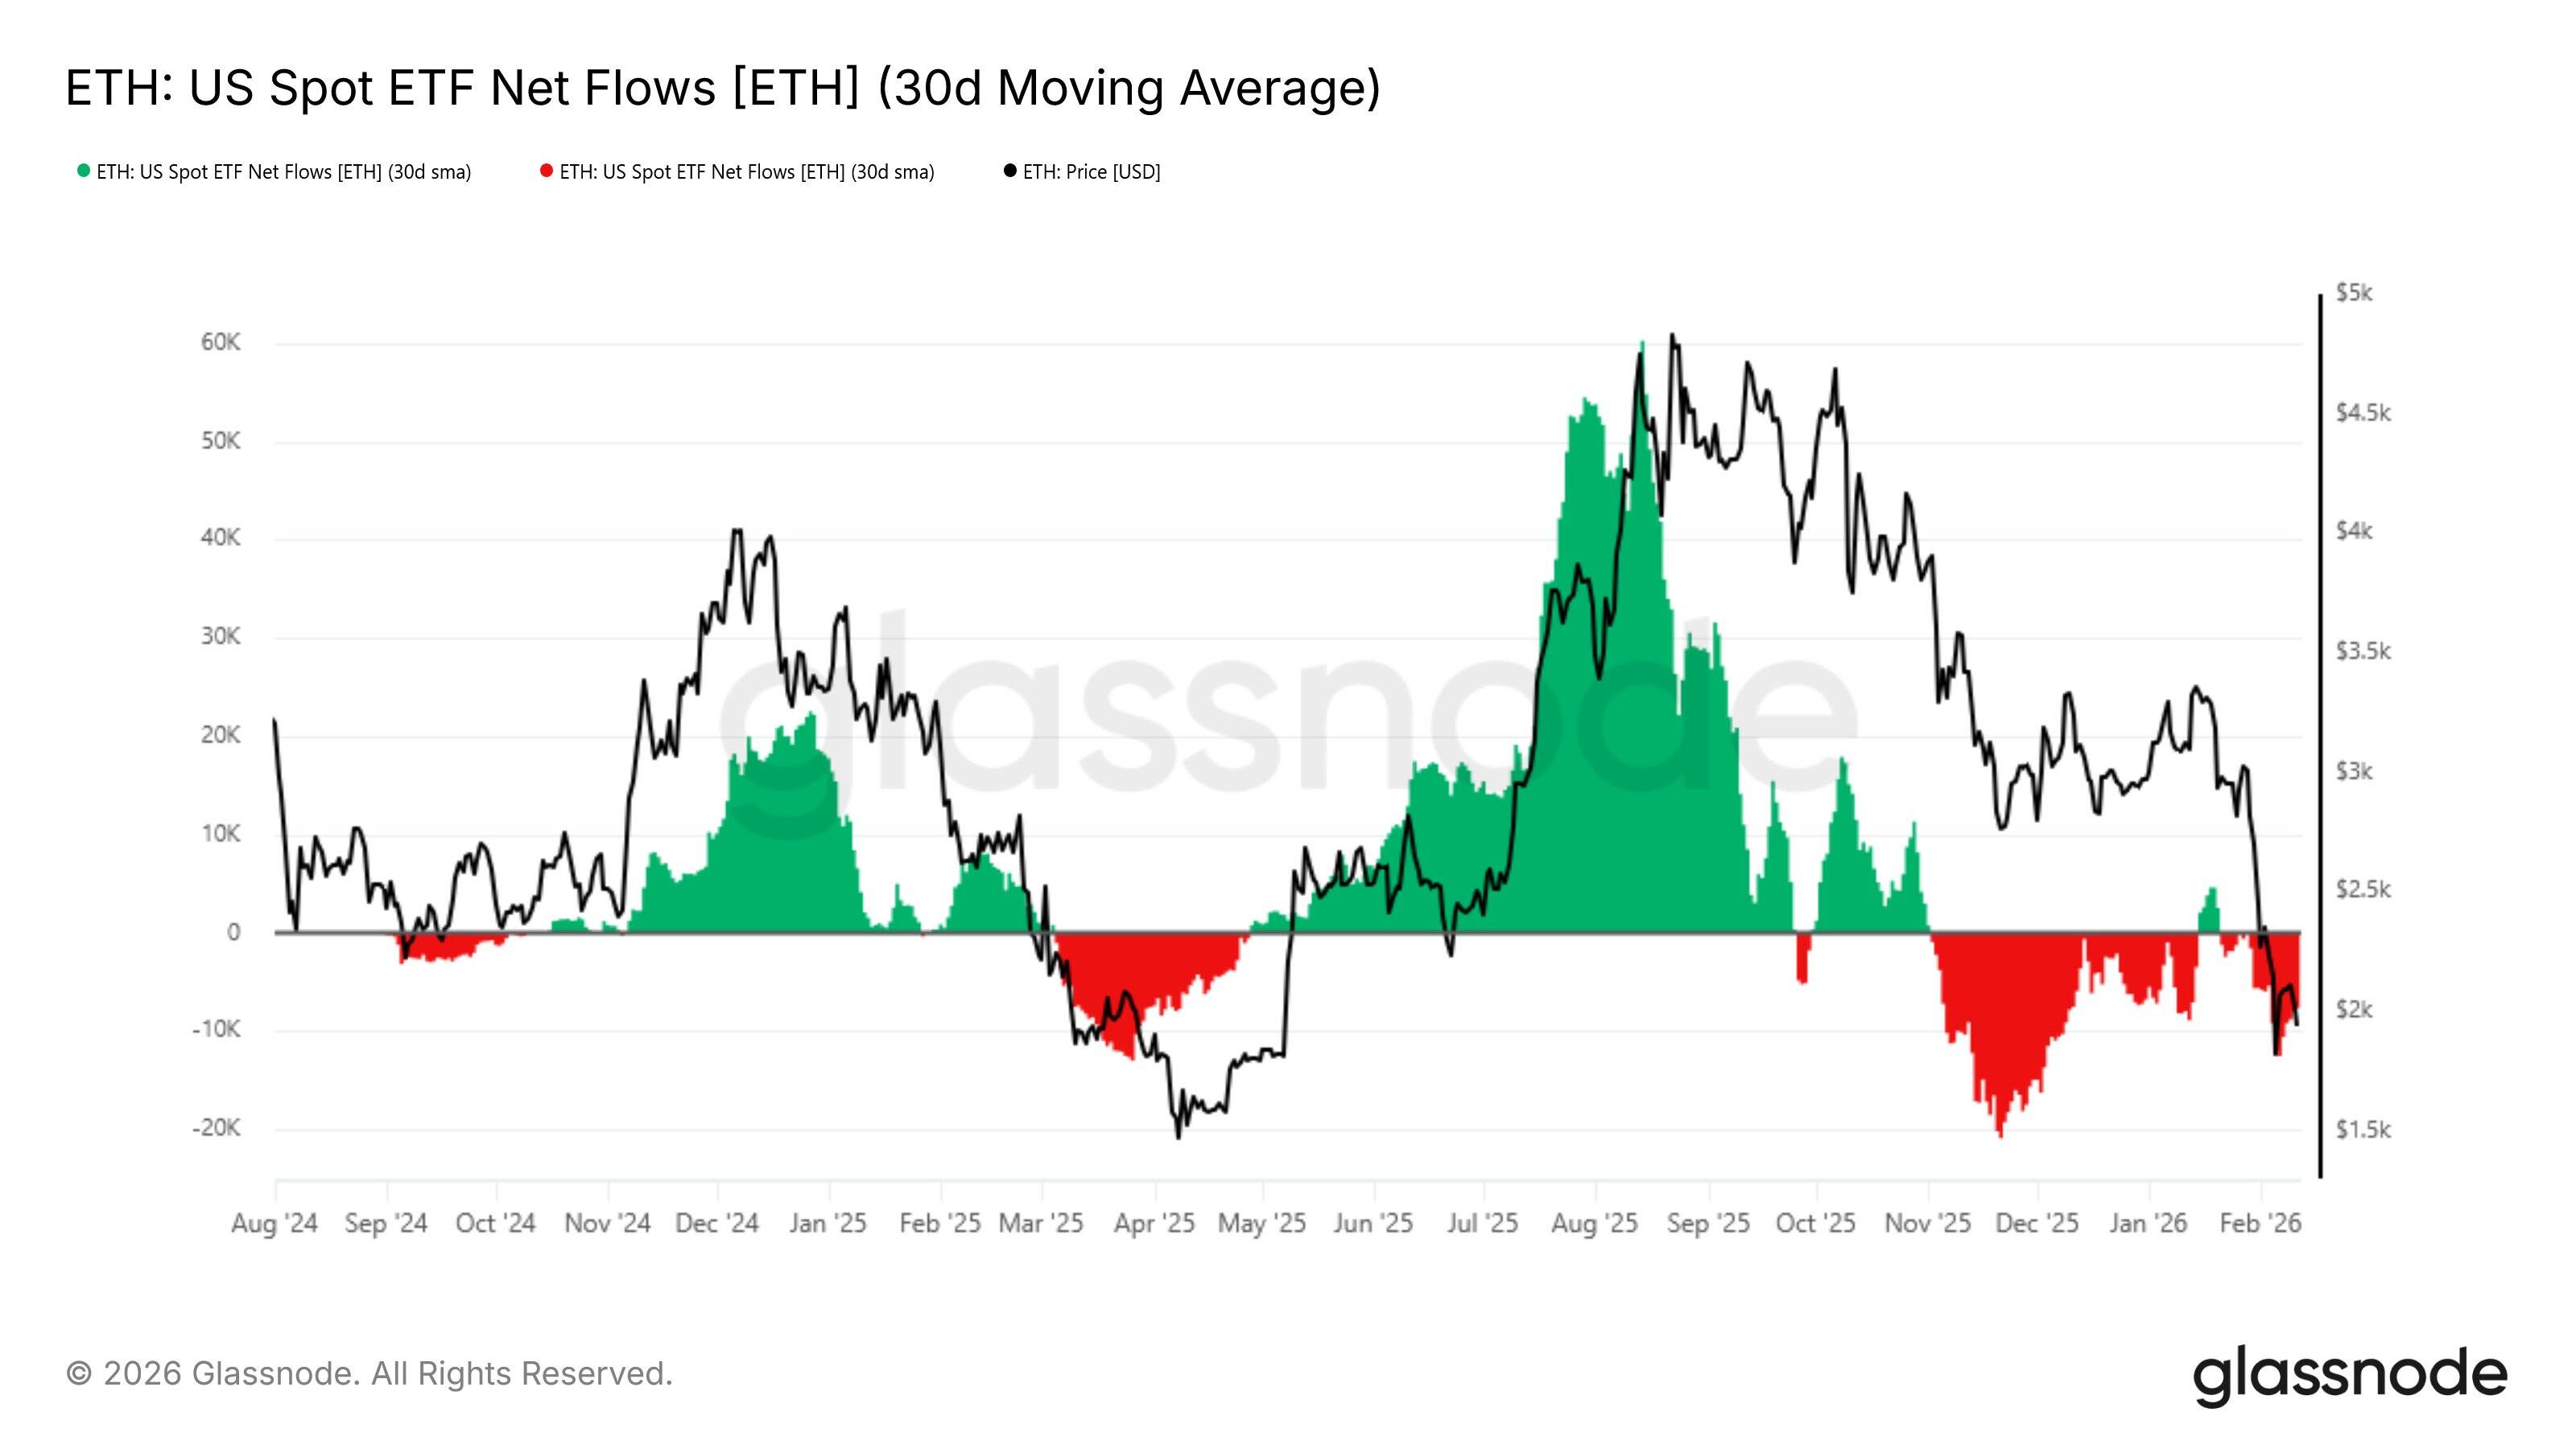
Persistent outflows signal muted institutional demand. While they do not guarantee immediate selling pressure, they make it harder for prices to absorb large exchange deposits or sustain rebounds.
The combination of negative ETF flows and large exchange deposits creates a challenging environment for bulls attempting to push through overhead resistance.
Ethereum price traded below $2,000 on some exchanges after failing to hold gains above that level. The cryptocurrency dipped toward $1,950 support following a break below a bullish trend line at $2,035. ETH now needs to hold above $1,920 to maintain the possibility of another increase toward resistance levels.


