


 Price: Why Whales Are Accumulating Right Now")


TLDR
- Ether dropped below $2,000 and is down 20% in February, but accumulation addresses added over 2.5 million ETH this month, bringing total holdings to 26.7 million.
- Ethereum network activity hit a record 17.3 million weekly transactions while median fees dropped to just $0.008, down from over $25 during 2021 peaks.
- ETH is forming an Adam and Eve bottom pattern on the four-hour chart, with a potential breakout above $2,150 that could target $2,473 to $2,634.
- Whales holding 10,000 to 100,000 ETH have accumulated 840,000 ETH since February 4, though exchange reserves increased by 180,000 ETH over five days showing continued selling pressure.
- Open interest dropped to $11.2 billion from $30 billion in August 2025, but 73% of global accounts remain long with over $2 billion in short positions clustered above $2,200.
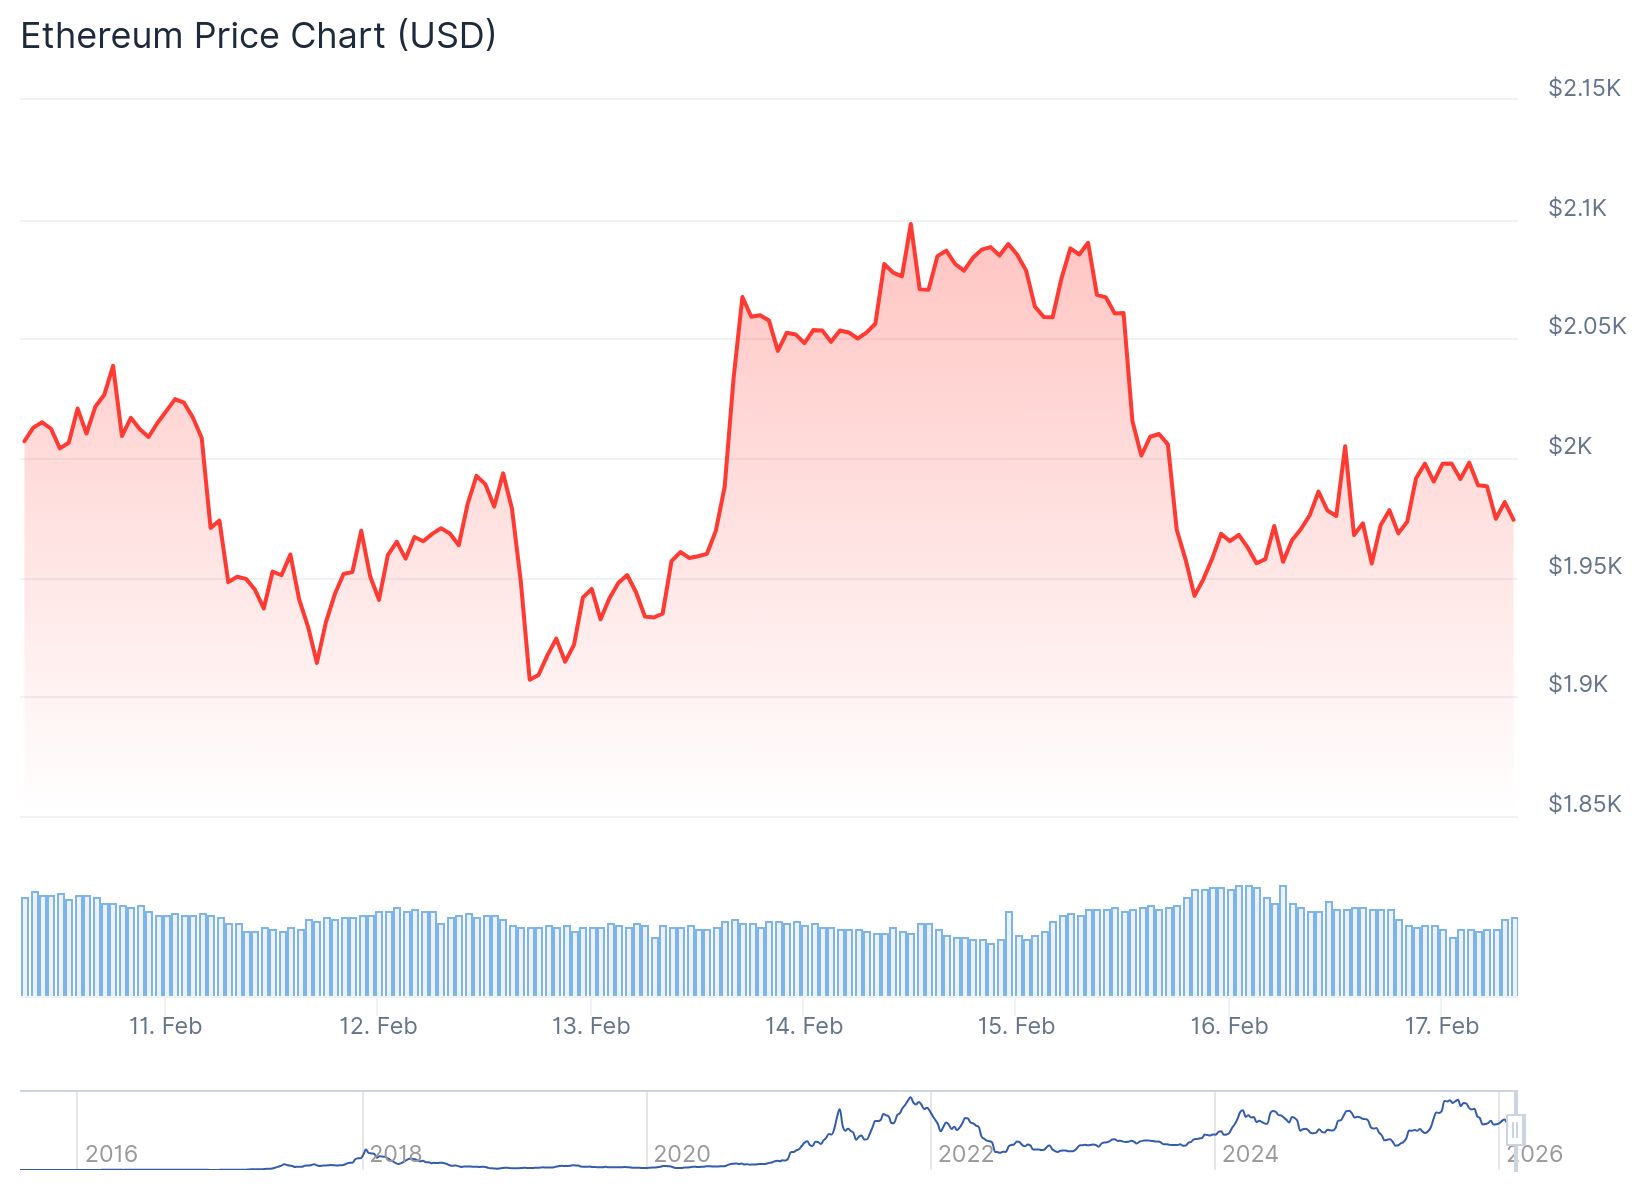
Ether started the week trading below $2,000 after posting a 20% decline through February. The drop brought ETH to $1,975, testing a key psychological level that traders have watched closely.
Despite the price decline, accumulation addresses added more than 2.5 million ETH during February. Total holdings in these addresses now stand at 26.7 million ETH, up from 22 million at the start of 2026.
Network activity continues to expand. Ethereum processed 17.3 million transactions last week, marking a new all-time high for weekly transaction volume. Transaction fees dropped sharply during this period.
The median transaction fee on Ethereum fell to $0.008. This represents a 3,000x decrease from 2021 peak levels when median fees exceeded $25. The combination of record transactions and ultra-low fees indicates growing network efficiency.
Staking activity remains strong. Over 30% of ETH’s circulating supply is currently staked, totaling 37,228,911 ETH. This staking activity reduces the liquid supply available on the market.
Whale Accumulation Continues
Whales holding between 10,000 and 100,000 ETH accumulated 840,000 ETH since February 4. This buying activity resumed after these large holders paused purchases earlier in the month.
-1771288997699-1771288997701.png&w=1536&q=95)
Smaller holders showed different behavior. Wallets containing 100 to 1,000 ETH and 1,000 to 10,000 ETH briefly accumulated at the start of last week. These retail-sized wallets then returned to selling as the week continued.

Exchange reserves tell a similar story. Ethereum exchange reserves increased by more than 180,000 ETH over the past five days. This metric measures total ETH supply held on exchanges.
US spot Ethereum exchange-traded funds recorded their fourth straight week of outflows. The ETFs saw $161.1 million in net outflows during this period, according to SoSoValue data.
Technical Pattern Forms Below $2,000
The four-hour chart shows Ether forming an Adam and Eve bottom pattern. This bullish reversal setup starts with a sharp V-shaped low followed by a slower, rounded base formation.
$ETH Potential Adam n Eve pattern formation Leading to a 2399$ target pic.twitter.com/ImSoKZ4j0O
— Moose (@Brownmoose) February 14, 2026
A breakout above the $2,150 neckline would validate the pattern. The measured move from this base projects a potential rally to the $2,473 to $2,634 range.
Current resistance sits at $2,107 on the daily chart. The 20-day Exponential Moving Average trends lower at $2,223, creating additional overhead resistance. Support levels appear at $1,909 and $1,741.
$ETH has broken below the $2,000 level.
There has been aggressive selling happening on Binance, probably by Garrett Bullish.
IMO, once the selling stops, Ethereum could have a relief rally. pic.twitter.com/4d4s5w35WF
— Ted (@TedPillows) February 16, 2026
The Relative Strength Index reads 33, staying below the neutral 50 level. This indicates weak momentum without reaching oversold territory.
Open interest in ETH futures declined to $11.2 billion from a cycle peak of $30 billion reached in August 2025. The estimated leverage ratio stands at 0.7, down slightly from 0.77 in January.
Hyblock data shows 73% of global accounts hold long positions on ETH. Liquidation heatmaps reveal over $2 billion in short positions clustered above $2,200. Long liquidations total roughly $1 billion near the $1,800 level.
The nearest dense liquidation cluster appears at $1,909, where $563 million in long positions face liquidation risk. Funding rates remain negative, indicating rising short positioning among derivatives traders.
ETH recorded $71 million in liquidations over the past 24 hours, with long positions accounting for $47 million of that total.


