


 Price: Support and Resistance Levels Traders Are Watching Right Now")


TLDR
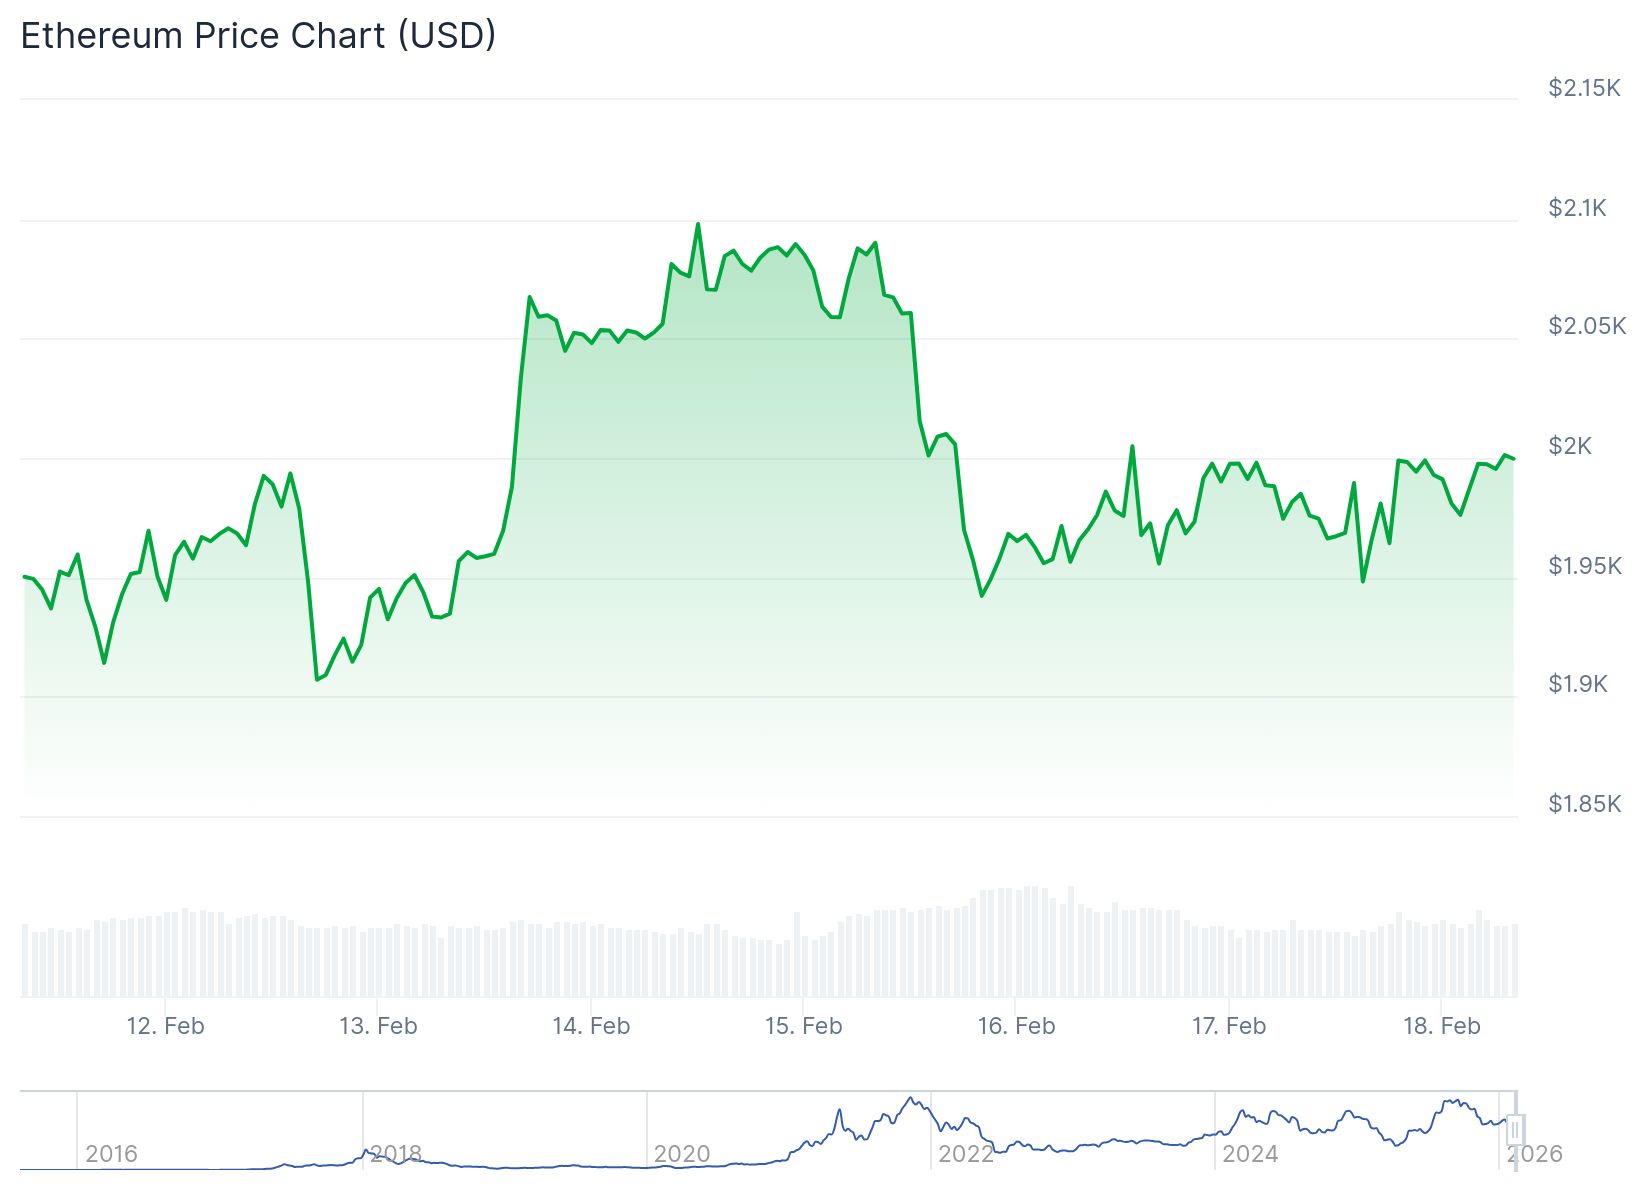
- ETH is trading between $1,950–$2,000, below all major EMAs, with sellers still in control
- Key resistance sits at $2,020–$2,030; breaking this is needed for any short-term recovery
- A $600M spot inflow spike in February hints at fresh accumulation interest
- Open interest has dropped to the mid-$20B range, reflecting lower leverage and caution
- Analysts are split: price could bounce to $2,650 if $1,800 holds, or fall to $1,300 if it breaks
Ethereum is hovering near the $1,950–$2,000 range after a steep drop from its recent high of around $3,400. The recovery has been slow, and the overall market structure still favors the sellers.
ETH is currently trading below its 20, 50, 100, and 200 exponential moving averages (EMAs). That’s a clear sign that the downtrend is still in place.
The drop began after ETH broke below $2,600, which picked up speed on the way down. Price found a floor near $1,746, which lined up with a key Fibonacci support level, before staging a bounce.
A recent low of $1,928 was set, and ETH has since climbed back above $1,965. There is now a bullish trend line forming on the hourly chart with support around $1,955.
Key Resistance Levels to Watch
The $2,020–$2,030 zone is the first major hurdle. This area is where the 20 and 50 EMAs are clustered, making it a wall that bulls need to break through.
$ETH tried to break above $2,000 again but failed.
The selling pressure on Binance has stabilized, which is a good thing.
Still, I'm looking for Ethereum to reclaim the $2,000 level with strong spot demand for upward continuation. pic.twitter.com/3BatpfjFpi
— Ted (@TedPillows) February 17, 2026
Above that, $2,137 is the next Fibonacci retracement level. A clean move past this point could open the door to $2,380, which analysts describe as the key ceiling for any medium-term recovery.

If ETH clears $2,380, the next targets would be $2,576 and $2,772. However, those levels are far off while price stays under the EMA cluster.
On the downside, $1,913 aligns with the lower Bollinger Band and is acting as dynamic support. If that breaks, $1,746 comes back into play.
Spot Inflows and Derivatives Data
Open interest in ETH derivatives has cooled from over $60 billion during previous rallies to around the mid-$20 billion range. This shows traders are using less leverage than before.
Spot flow data told a negative story for most of late 2025, with net outflows running for months. February changed that, with a single inflow spike of over $600 million recorded.
Analyst Price Targets
Analyst Crypto Patel says ETH needs to hold the $1,800 level. If it does, a move to $2,650 is possible. If $1,800 breaks, his target drops to $1,300.
$ETH Broke My Heart Twice
First Dagger → Bull Flag lost & BreakDown $3,700 Level.
Second Dagger → Ascending Triangle failed and Broken $3,000 SupportNow Trading Between $2000-$1850
Watching These Levels Closely:
Hold $1,800 → Relief Bounce Toward $2,650
Lose $1,800 →… pic.twitter.com/rpAYK2yyNa— Crypto Patel (@CryptoPatel) February 16, 2026
Analyst Javon Marks points to a hidden bull divergence pattern on the chart. He says a full recovery could take ETH back to the $4,900 area, which would be above its all-time high.
ETH is currently trading below $2,000 and the 100-hourly simple moving average, with $2,015–$2,035 as the next immediate resistance zone.


