


 Price: The RSI Just Hit Its Lowest Point in 12 Years — Here’s What Analysts Are Saying")


TLDR
- Dogecoin broke above key resistance at $0.0924 on volume 176% above baseline, turning it into short-term support.
- DOGE is consolidating between $0.0940–$0.0945 with higher lows forming after the breakout.
- The next upside targets are $0.0955–$0.0960; a drop below $0.0924 would signal a failed breakout.
- Dogecoin’s 2-week RSI has hit its lowest level since launch, with analysts calling it potentially oversold.
- One analyst sees a possible rebound to $0.12 from the oversold zone, with a longer-term chart target of $0.30.
Dogecoin rose roughly 5% after breaking above a resistance level that had blocked multiple attempts earlier in the session. The move pushed DOGE from around $0.0926 to a high near $0.0950 before the price settled into a tight range between $0.0940 and $0.0945.
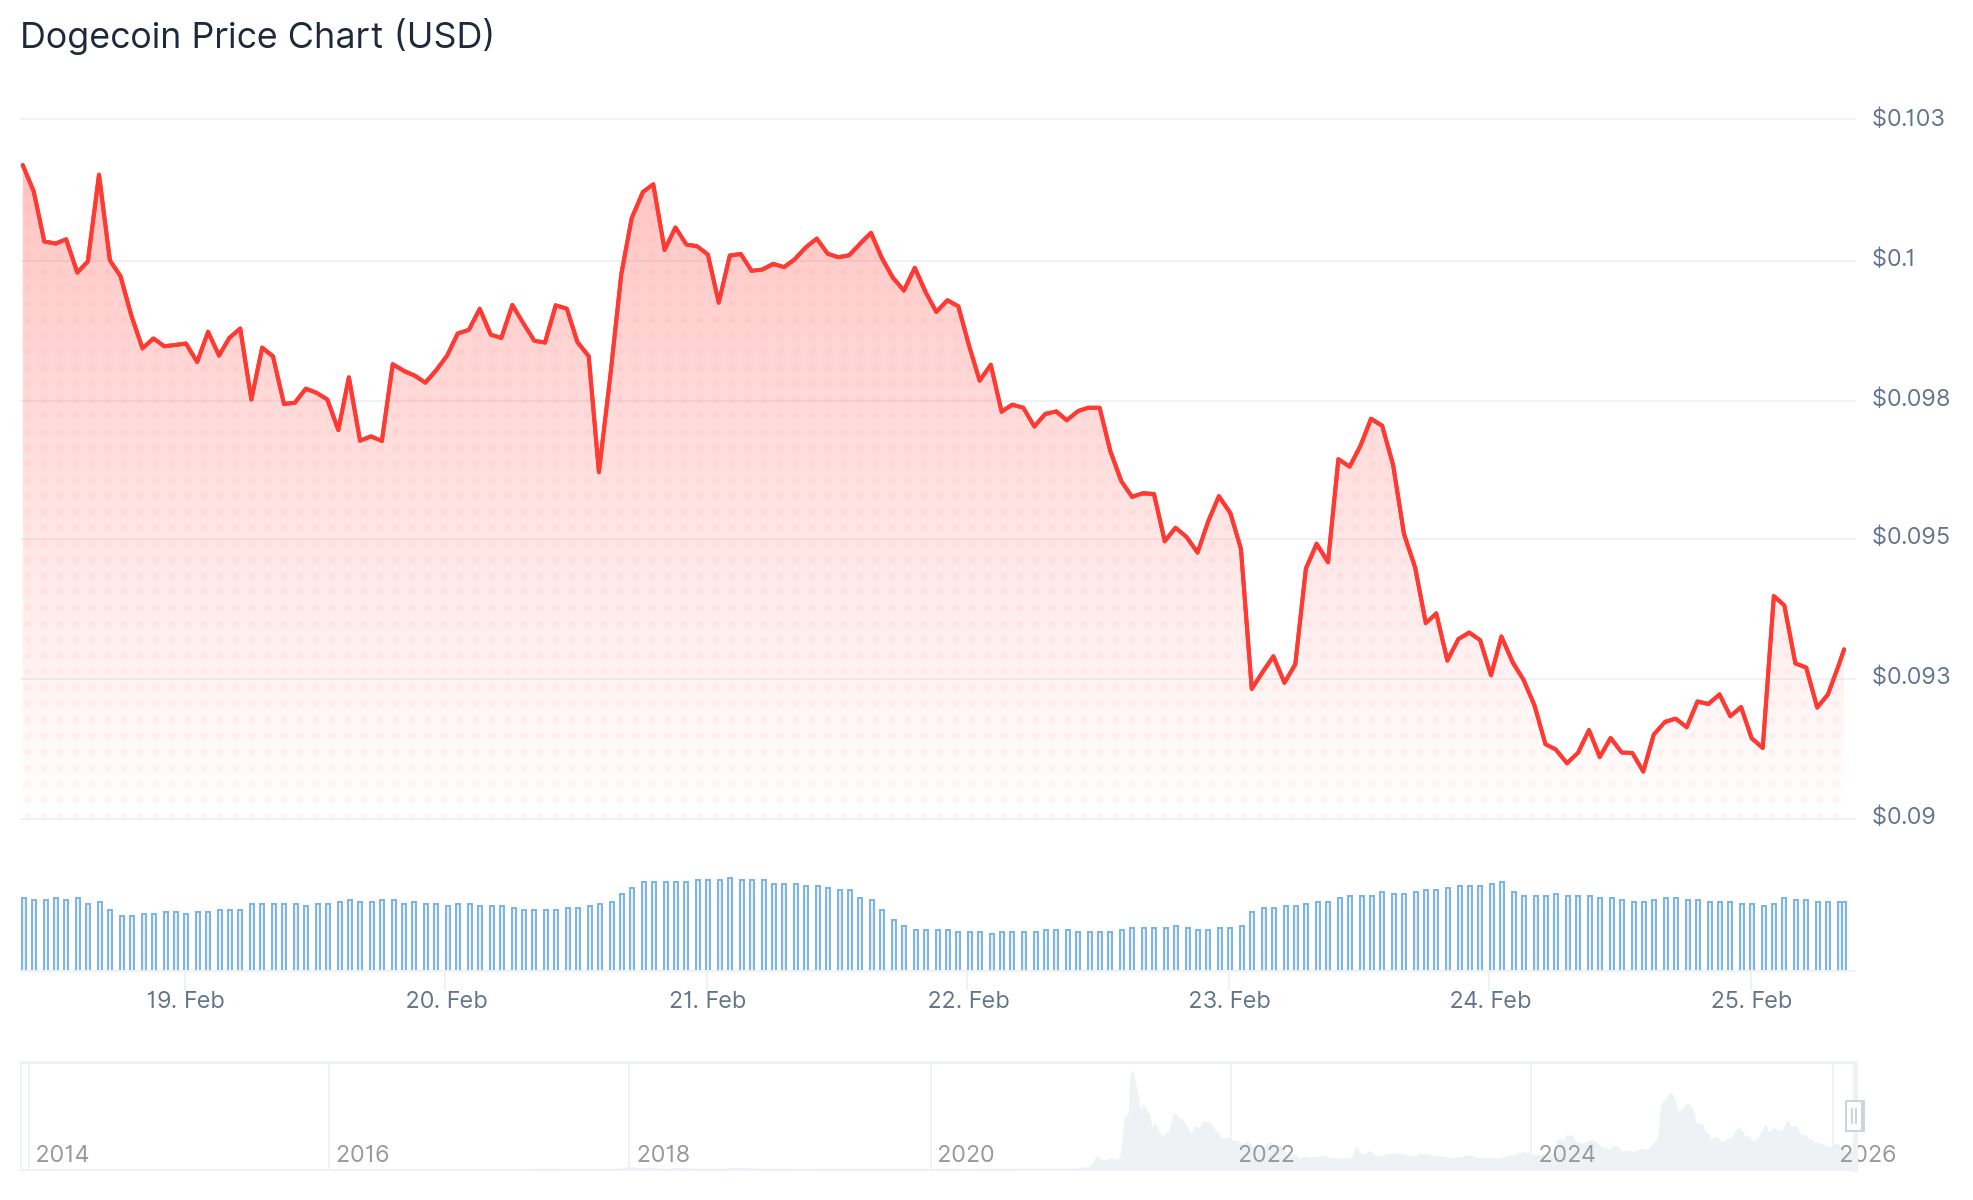
The breakout at $0.0924 came on volume of 749 million, which was 176% above the baseline. That level has now flipped from resistance to short-term support.
Higher lows formed during the consolidation phase, which traders typically read as a sign that buyers are defending the breakout zone.
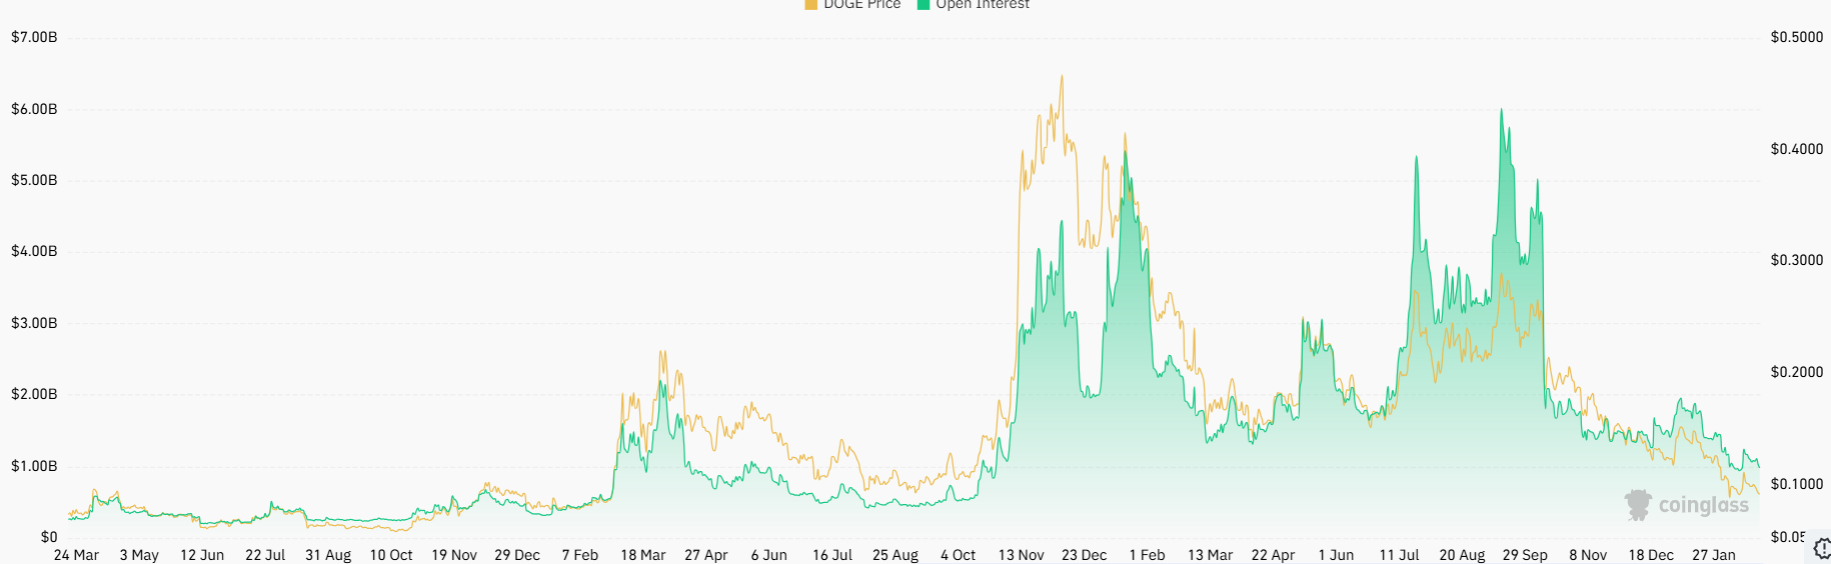
Open interest is elevated but not extreme, pointing to moderate leverage in the market rather than a heavily crowded trade.
Traders are watching $0.0940 as the key level. As long as DOGE holds above it, short-term structure favors a move toward $0.0955–$0.0960.
A drop back below $0.0924 would suggest the breakout failed and could pull price back into the prior consolidation range.
RSI Hits Lowest Level Since Launch
Separately, crypto analyst Cryptollica flagged that Dogecoin’s 2-week RSI has dropped to its lowest reading in 12 years. The analyst described it as the “absolute oscillator floor.”

DOGE 2W: The First RSI All-Time Low in 12 Years ‼️
"OVERSOLD" 💯
Removing all social sentiment and "meme" narratives, the 2-Week chart of DOGE provides one of the most severe structural anomalies currently visible in the market.
Macro Cycle Floor The chart explicitly maps the… pic.twitter.com/GslQ9AgBFx
— Cryptollica⚡️ (@Cryptollica) February 22, 2026
The RSI has fallen to the 34 threshold on the 2-week chart. Cryptollica noted that current downward momentum is mathematically weaker than it was during the 2015 bear market and the 2020 COVID crash.
The analyst said selling pressure appears fully exhausted at current levels and that DOGE has compressed to a structural baseline that has historically preceded major expansions.
Cryptollica’s longer-term chart shows a potential range between a midline target of $0.30 and an upper target of $1.30, with a possible bullish reversal window between now and July 2026.
Analyst Sees Rebound Potential
Analyst Trader Tardigrade also noted that Dogecoin has bounced from the RSI oversold zone. His chart points to a potential rebound toward $0.12.
$Doge/weekly#Dogecoin Pump 1 followed Base 1.
For now, it’s holding above Base 2; Pump 2 will follow.🔥 pic.twitter.com/Xa6rjLpMgp— Trader Tardigrade (@TATrader_Alan) February 23, 2026
DOGE spent several hours coiling between $0.090 and $0.0927 before the breakout occurred. The compression period appeared to build the energy behind the eventual move.
At the time of writing, DOGE was trading near $0.0944, holding above the $0.0940 support level with higher lows intact.


