


 Price: Drops 5% as U.S.-Israel Launch Strikes on Tehran – Watch These Levels")


TLDR
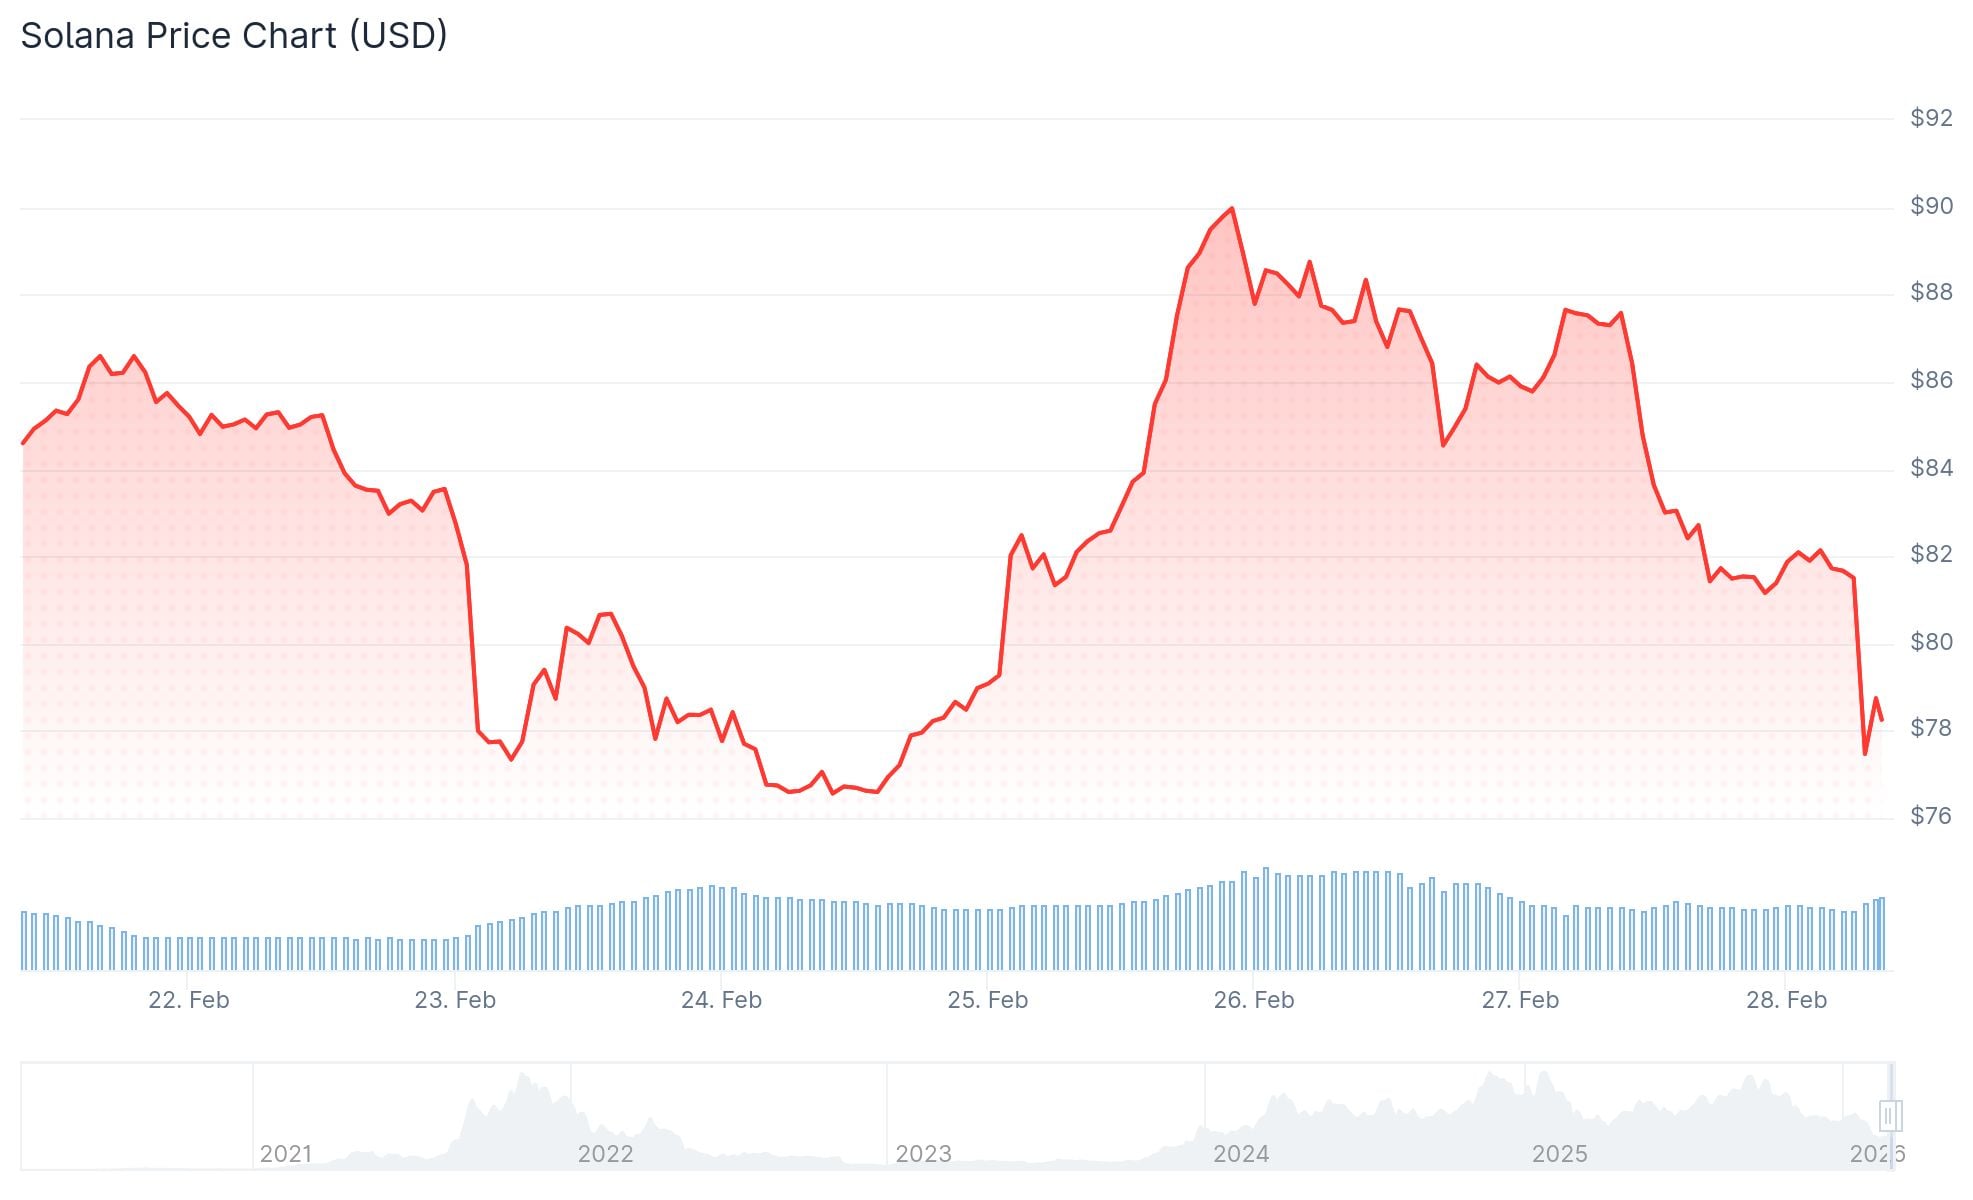
- SOL is down 72% from its all-time high of $295, currently trading around $78
- Spot SOL ETFs have seen minimal outflows ($11.3M) compared to Bitcoin and Ethereum ETFs which logged four consecutive months of negative flows
- Solana led DEX volume over the past 30 days with $108 billion, beating Ethereum’s $63.7 billion
- Key support levels identified at $50, $22, and $10 based on a Parallel Channel pattern
- The Israel-Iran conflict triggered a broader crypto sell-off, pushing Bitcoin toward $60,000 and adding pressure on altcoins like SOL
Solana’s SOL token is currently trading at $78, down 72% from its all-time high of $295. The drop comes during a broader crypto market decline, with geopolitical tensions adding fresh pressure on February 28, 2026.
Israel launched a strike against Iran on Saturday morning local time. The U.S. participated in the attack, according to AP sources. Bitcoin dropped nearly 5% in minutes, falling toward $60,000, and the sell-off hit altcoins including SOL.
BREAKING: Bitcoin falls below $64,000 as Israel launches strikes on Iran.
Over $100 million worth of levered longs have been liquidated in 15 minutes. pic.twitter.com/S4SibWkks3
— The Kobeissi Letter (@KobeissiLetter) February 28, 2026
Despite the price drop, Solana’s network numbers remain strong. Over the past 30 days, Solana processed $108 billion in DEX volume, ahead of Ethereum’s $63.7 billion and Base’s $31.48 billion.
In the last 24 hours, Solana generated $3.1 million in app revenue versus Ethereum’s $2.95 million. Active addresses on Solana stood at 2.17 million, compared to Ethereum’s 682,236.
Solana’s real-world asset (RWA) sector has reached an all-time high of $1.71 billion, up 45% in 30 days.
SOL ETF Flows Hold Steady
Spot SOL ETFs launched in late October 2025 and pulled in over $100 million in average net inflows during their first five weeks. Weekly inflows have since slowed to $20–$25 million as the price declined.


Cumulative outflows across the four-month drawdown total just $11.3 million over two weeks. Bitcoin and Ethereum ETFs, by contrast, logged four consecutive months of negative flows in the same period.
Solana is currently trading well below the $188 level seen at the time of its ETF launch.
Key Support Levels to Watch
Analyst Ali Martinez pointed to a Parallel Channel forming on SOL’s weekly chart. Based on this pattern, support levels sit at $50.22, $22.47, and $9.98.
If momentum weakens, these are the next major support levels for Solana $SOL:
• $50.22
• $22.47
• $9.98 pic.twitter.com/0kGKtvdb9n— Ali Charts (@alicharts) February 27, 2026
Analyst Crypto Scient identified two additional areas. The first is the 0.75 Fibonacci retracement zone between $60 and $70. The second is a weekly demand fair value gap between $22 and $29.
UTXO data from Glassnode shows over 6% of SOL supply last moved within the current price cluster. The next major concentration of supply, above 3%, sits between $20 and $30.
SOL is currently trading below the weekly resistance level of $120. The $51 to $80 zone on the weekly chart has been tested and aligns with the retracement pocket analysts are watching.
On February 28, 2026, SOL was trading at $78 as markets reacted to the Israel-Iran conflict.


