


 Price: Token Holds Support as Chart Signals Line Up for Potential Rally")


TLDR
- SOL dropped below $88 after failing to hold above $90, but is finding support around $85
- RSI sits at 47.68 — neutral, with no strong buy signal yet
- SOL reclaimed the Ichimoku cloud on the 4-hour chart for the first time since January
- Analysts are watching $88.60 as the key breakout level; a break above could push toward $95–$100
- The 50MA crossed back above the 100MA, signaling a short-term momentum shift
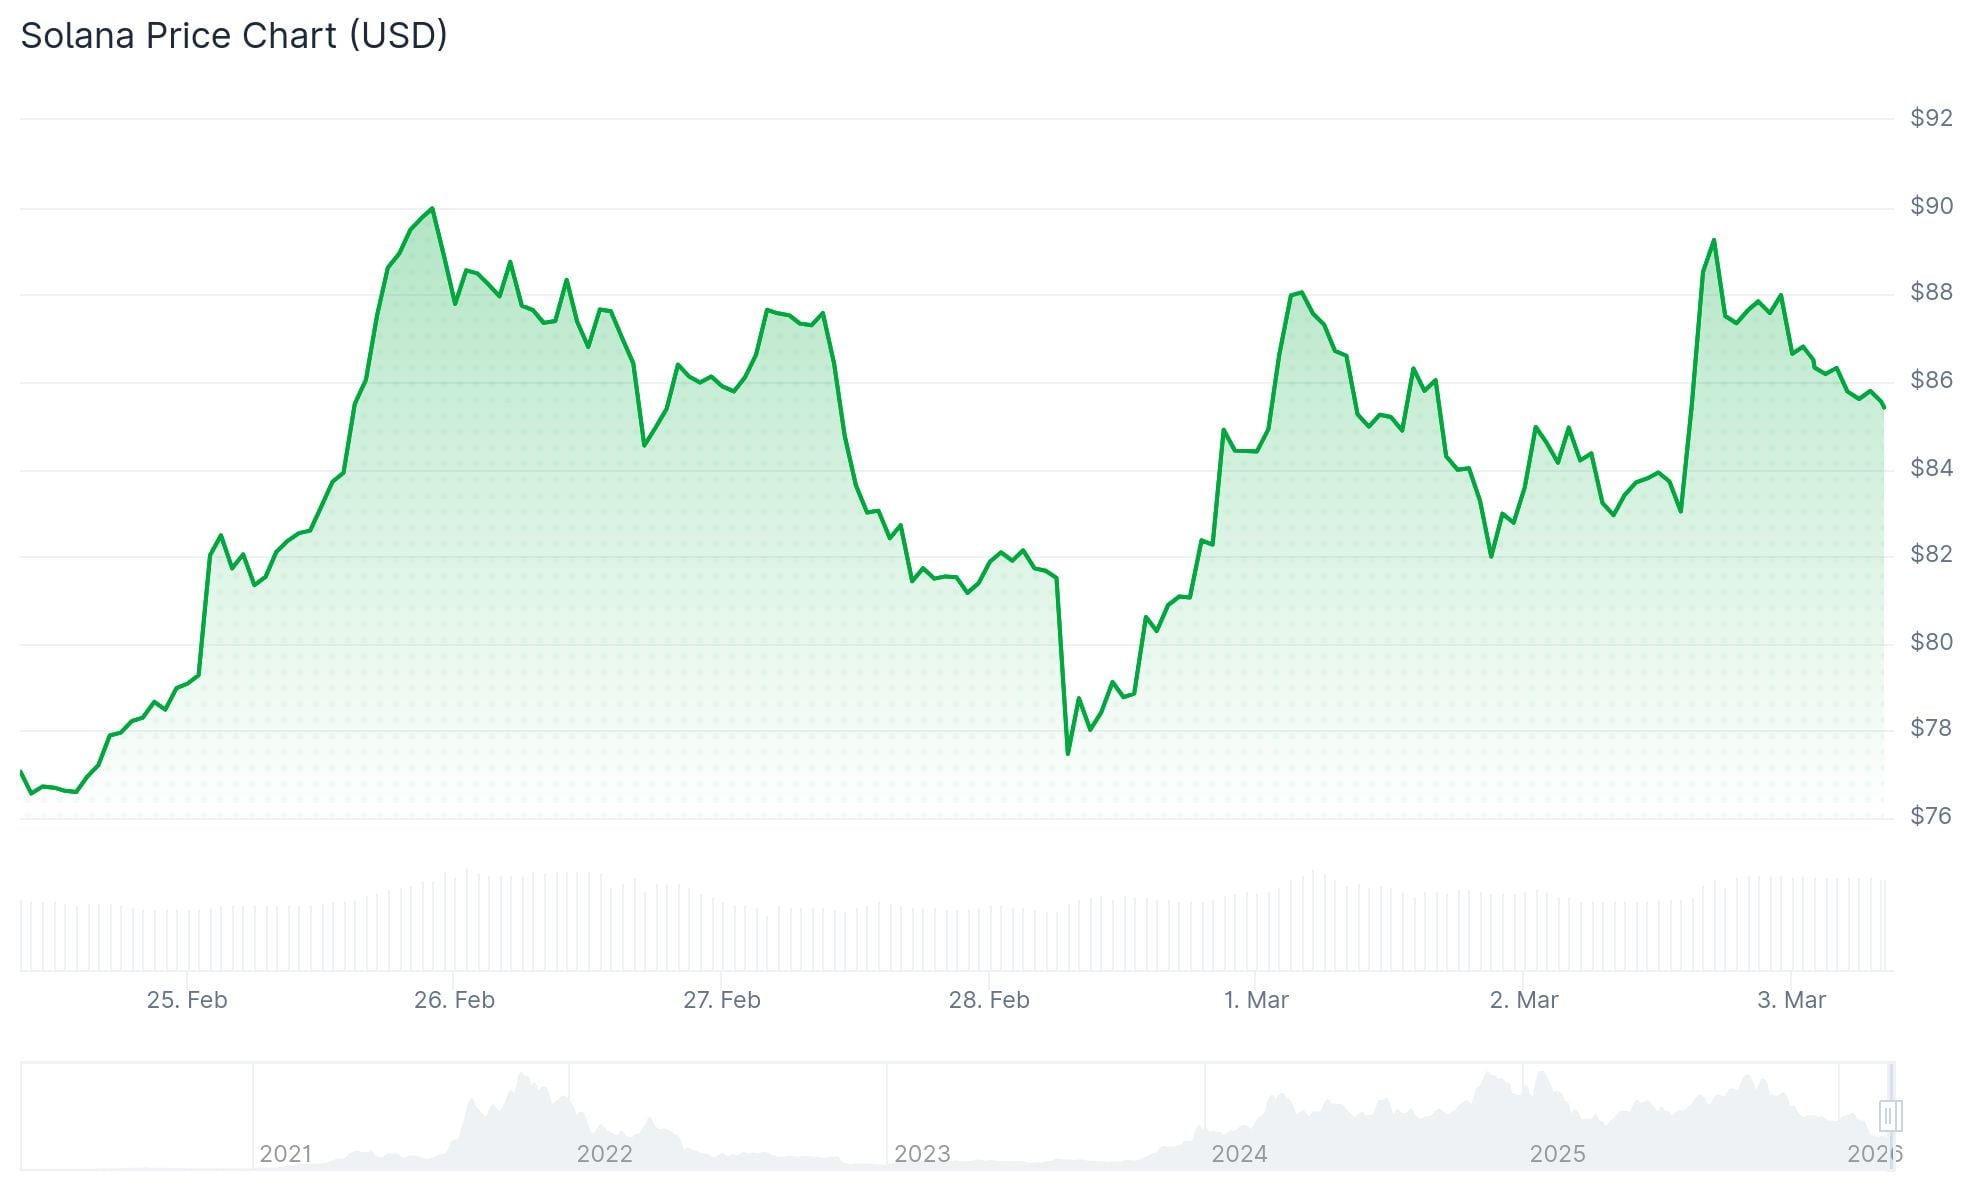
Solana (SOL) is trading around $87–$88 after pulling back from a recent high of $90.29. The price dipped below both $88 and $87 before finding footing above the $85 support level.
SOL is now holding above the 100-hourly simple moving average. The 24-hour trading volume sits at $9.99 billion, with a market cap of $49.91 billion. The price is up 4.70% over the past 24 hours.
The current pullback took price below the 50% Fibonacci retracement of the move from $81.71 to $90.29. A bullish trend line is forming on the hourly chart with support near $85, which also lines up with the 61.8% Fib level.
Market analyst BitGuru noted on March 2 that SOL may have exited its corrective phase and entered consolidation. He pointed to higher lows forming near a defined support zone as evidence of weakening selling pressure.
$SOL looks like it has finished the downtrend and moved into a long consolidation phase.
Now price is trying to rebound from support with higher lows forming. If this range breaks to the upside, momentum can build fast and push SOL back toward the $95–$100 zone. pic.twitter.com/UFi7RJNI1N
— BitGuru 🔶 (@bitgu_ru) March 2, 2026
Analysts are watching $88.60 as the first key level to reclaim. Market commentator More Crypto Online said a move above the Sunday high at $88.60 would signal buyers are regaining control.
Key Resistance Levels to Watch
Resistance sits at $88, then $90, and $92. A close above $92 could open the path toward $96 and then $100.

If SOL fails to break above $90, the next downside levels are $84, then $82. A close below $82 could send price toward $76.50.
The RSI is at 47.68 — in the neutral zone. The MACD is at 1.80, slightly positive, but still below the signal line at -4.29. Bears are easing, but bulls have not taken full control.
Solana is trading well below its longer-term moving averages. The 50-day SMA is at $103.66, the 100-day at $117.73, and the 200-day at $156.34.
Ichimoku Cloud Break Signals Shift
On the 4-hour chart, SOL moved back above the Ichimoku cloud for the first time since January. Throughout February, every rally stalled below that cloud structure.
solana has flipped the 50/100 MA + is above the 4hr ichi cloud for the 1st time since january
$100+ SOL coming soon.#SOLANA ⚡️ pic.twitter.com/1DeULkXgHI
— curb.sol (@CryptoCurb) March 2, 2026
The 50-period moving average also crossed back above the 100-period moving average on the 4-hour chart. Analyst CryptoCurb described this as a structural change in trend conditions.
Both moving averages have begun turning upward. A chart projection shared by CryptoCurb points toward a potential move to $100 and beyond, contingent on price holding above the reclaimed levels.
For now, SOL is trading at $87.64 with early recovery signals present but no confirmed trend reversal yet.


