


 Price: Grayscale Makes the Bull Case as SuperTrend Indicator Turns Bullish")


TLDR
- Solana’s SuperTrend indicator flipped bullish on March 13 for the first time since early January.
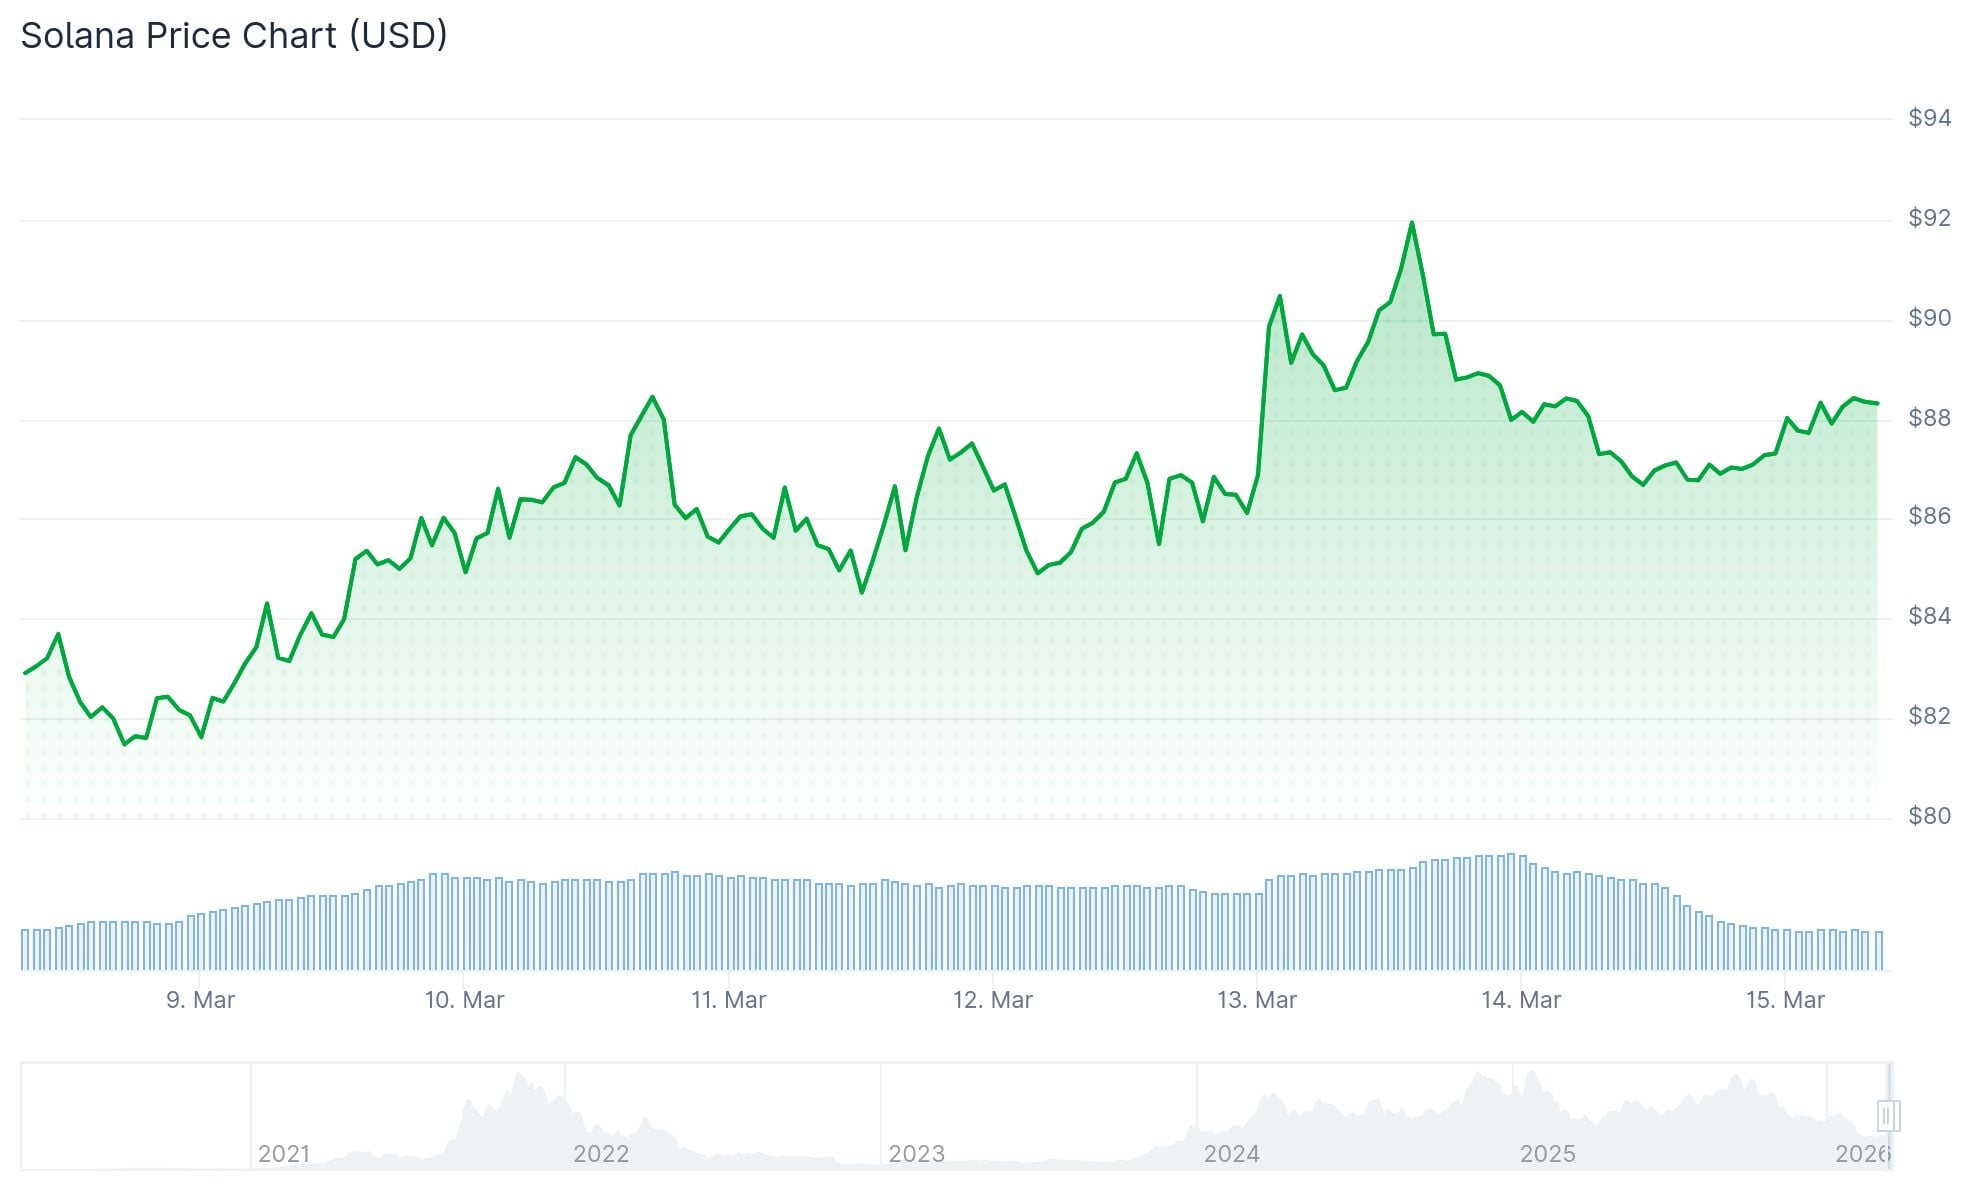
- SOL has dropped roughly 67% from its September 2025 peak, with the current price around $88–89.
- Weekly technicals remain bearish, with 15 of 17 indicators signaling a sell.
- Grayscale’s head of research flagged SOL as a potential buy at its current discount.
- Solana Spot ETF cumulative inflows have reached $961–$968 million, with weekly inflows slowing sharply.
Solana (SOL) has flashed its first bullish technical signal in roughly two months, even as the broader chart picture remains firmly in bear territory. The development has drawn attention from analysts and institutional researchers alike.
After peaking above $240 in late 2025, SOL entered a long, painful decline. The asset fell through major support levels one by one, eventually finding a floor in the $67–$80 range in early 2026.
Over the past four weeks, Solana has traded in a range between $76 and $90. It briefly pushed above $90 twice in March, with the latest attempt coinciding with the SuperTrend buy signal on the daily chart.
What the SuperTrend Signal Means
The SuperTrend indicator is a technical tool that tracks market trend direction using price and volatility data. Analyst Ali Martinez flagged the bullish flip on March 13 via X.
For the first time since early January, the SuperTrend indicator has turned bullish on Solana $SOL. pic.twitter.com/oCv8A6R93r
— Ali Charts (@alicharts) March 13, 2026
This is the first bullish reading from the indicator since early January. A sell signal appeared in early February, around the time SOL dropped to $67.
The signal points to potential short-term momentum, but it does not confirm a sustained recovery. The indicator can produce false signals, and the broader technical picture complicates the picture.

$SOL/monthly
Textbook Cup and Handle pattern on #Solana 📈
Nothing complicated here — just follow basic TA. The pattern is clear, the setup is bullish.
The only question is whether you have the faith to act on it 💭 pic.twitter.com/vnNEAp1bzy
— Trader Tardigrade (@TATrader_Alan) March 13, 2026
On the weekly chart, TradingView’s summary shows 15 indicators pointing to a sell and only 2 to a buy. Every major moving average sits above the current price. The EMA10 is at $98.47, the SMA200 at $103.70, and the EMA200 at $119.62 — all flagging sell.
The RSI sits at 32.34, approaching but not yet confirming oversold territory. The MACD is printing negative at -23.70.
For a structural shift, analysts say SOL would need to reclaim the SMA200 at $103.70 as a minimum.
Grayscale and Institutional Interest
On March 13, Grayscale Head of Research Zach Pandl published a six-point investment case for SOL, pointing to the roughly 67% drawdown from September 2025 highs as a potential entry point.
Grayscale has more than a few reasons why we're so optimistic about @solana's future.
1️⃣ Leader in users, transactions & fees
2️⃣ Positioned for growth amid regulatory clarity
3️⃣ Staking rewards for network participation
4️⃣ ~67% below Sept 2025 highs
5️⃣ Strong network effects
6️⃣… pic.twitter.com/TAO08npACg— Grayscale (@Grayscale) March 13, 2026
Pandl cited Solana’s lead in users, transactions, and fees across smart contract platforms over the past year. He also referenced regulatory progress around stablecoins and tokenized assets as a potential tailwind.
Solana Spot ETF daily inflows on March 13 came in at $7.60 million, all from Bitwise’s BSOL. Cumulative net inflows across listed products now stand between $961 and $968 million, with total net assets around $824–$855 million.
That said, weekly ETF inflows have dropped sharply. Total inflows for the current week came in at $3.10 million — down 83% from the prior week.
SOL is currently trading at around $88.95, up 2.8% in the past 24 hours and 11.15% over 30 days. The asset’s total market cap sits at approximately $54.74 billion, ranking it seventh among all cryptocurrencies.


