


 Price: Whales Accumulate 540K ETH as Exchange Inflows Drop to 10-Month Low")


TLDR
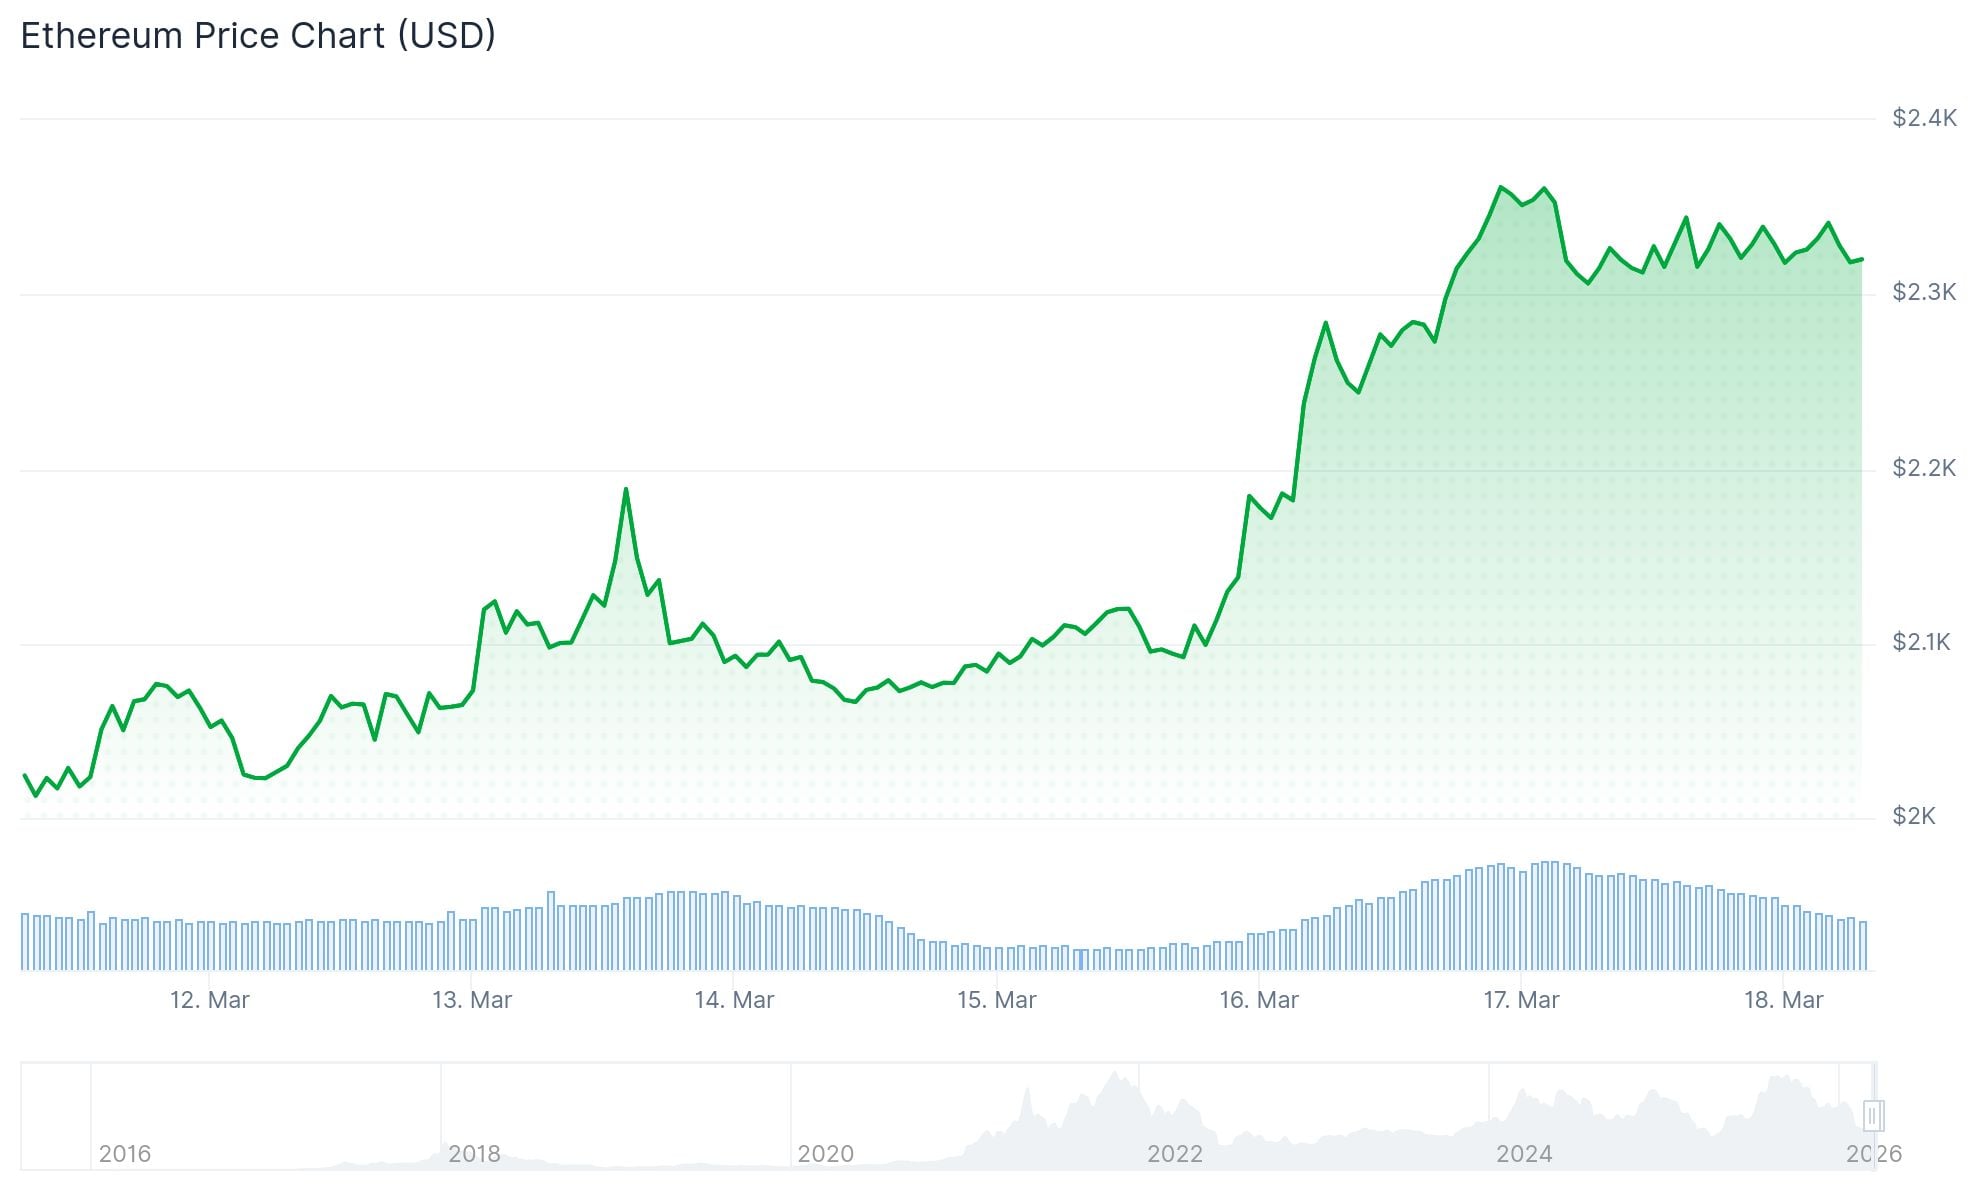
- Ethereum is trading around $2,330, up over 12–14% in the past week
- Exchange inflows to Binance hit a 10-month low, reducing selling pressure
- Whales accumulated 540,000 ETH last week, a key driver of price strength
- US spot ETH ETFs saw $248 million in net inflows over five consecutive days
- Key resistance sits at $2,388, with support levels at $2,260 and $2,150
Ethereum has climbed back above the $2,300 mark for the first time since early February, trading around $2,330 as of March 18, 2026.
The price rise comes alongside a notable drop in exchange inflows, which have fallen to their lowest level in 10 months. On-chain data from CryptoQuant shows fewer ETH deposits hitting exchanges like Binance, which typically signals reduced intent to sell.
336,000 Ethereum $ETH have been withdrawn from crypto exchanges in the past week. pic.twitter.com/kkzPquOTmo
— Ali Charts (@alicharts) March 16, 2026
Investors appear to be moving coins into cold storage or private wallets rather than onto exchanges. This tightens available supply and can make the price more sensitive to demand shifts.
ETH has also climbed back above its realized price — the average cost at which all investors bought in — which sits at around $2,306. This level is often watched closely as a potential support or resistance zone.
-1773782290321-1773782290322.png&w=1536&q=95)
Whale Accumulation Drives Recent Gains
Large wallets holding between 10,000 and 100,000 ETH accumulated over 540,000 ETH last week. This whale buying has been identified as a key driver of the recent price move.
Retail holders, by contrast, offloaded a combined 370,000 ETH during the same period. However, that selling activity has been slowing down.

Exchange Netflow data shows outflows have dominated in recent weeks, adding further evidence of accumulation rather than distribution.
US spot Ethereum ETFs recorded five straight days of net buying totalling $248 million — the first such streak since mid-January.
Technical Levels to Watch
Ethereum is trading above both its 20-day and 50-day exponential moving averages, which sit near $2,100 and $2,220 respectively. The RSI is holding in the mid-60s, reflecting steady buying pressure.
The immediate resistance zone is between $2,380 and $2,400. A close above $2,388 would open the door toward the $2,500–$2,746 range.
Support levels sit at $2,320, $2,260, and $2,150. A drop below $2,260 could bring a CME futures gap at $2,117 into play.
$ETH filled the first CME gap yesterday.
However, a new CME gap has formed at $2117.
For a stable bull market, it is better to fill that gap.
A decline of this magnitude is ultimately nothing more than noise. Also, that drop has a effect of liquidating high-leverage long… pic.twitter.com/SJawGyOHZt
— CW (@CW8900) March 17, 2026
On March 17, data analyst CW flagged that a new CME gap formed at $2,117 after ETH filled an earlier gap. These gaps can pull price back toward them in the short term.
ETH saw $100.5 million in futures liquidations in the past 24 hours, with $68.2 million of that coming from short positions.
Monthly chart analysis shows ETH holding above a key support zone between $1,900 and $2,100, a level that has acted as structural support multiple times before.


