


 Price: Bottom Signal, ETF Inflows, and a Trendline Break — What’s Next?")


TLDR
- A rare weekly chart pattern has reappeared on SOL — the same signal preceded a 1,604% rally in 2023 and a 142% rally in 2025
- SOL is trading around $94, holding above the key $93.50 support level after breaking a descending trendline
- Spot SOL ETFs recorded $17.81 million in inflows on Tuesday, the fifth straight day of positive flows since March 10
- Key resistance levels to watch are $120 and $125; the previous all-time high weekly close sits at $250
- Open interest remains below $2.3 billion, suggesting traders are cautious and no aggressive leverage has built up yet
Solana is trading near $94 this week after breaking above a key resistance trendline. Two separate chart setups have caught the attention of traders, and institutional inflows into spot SOL ETFs have continued for five straight days.
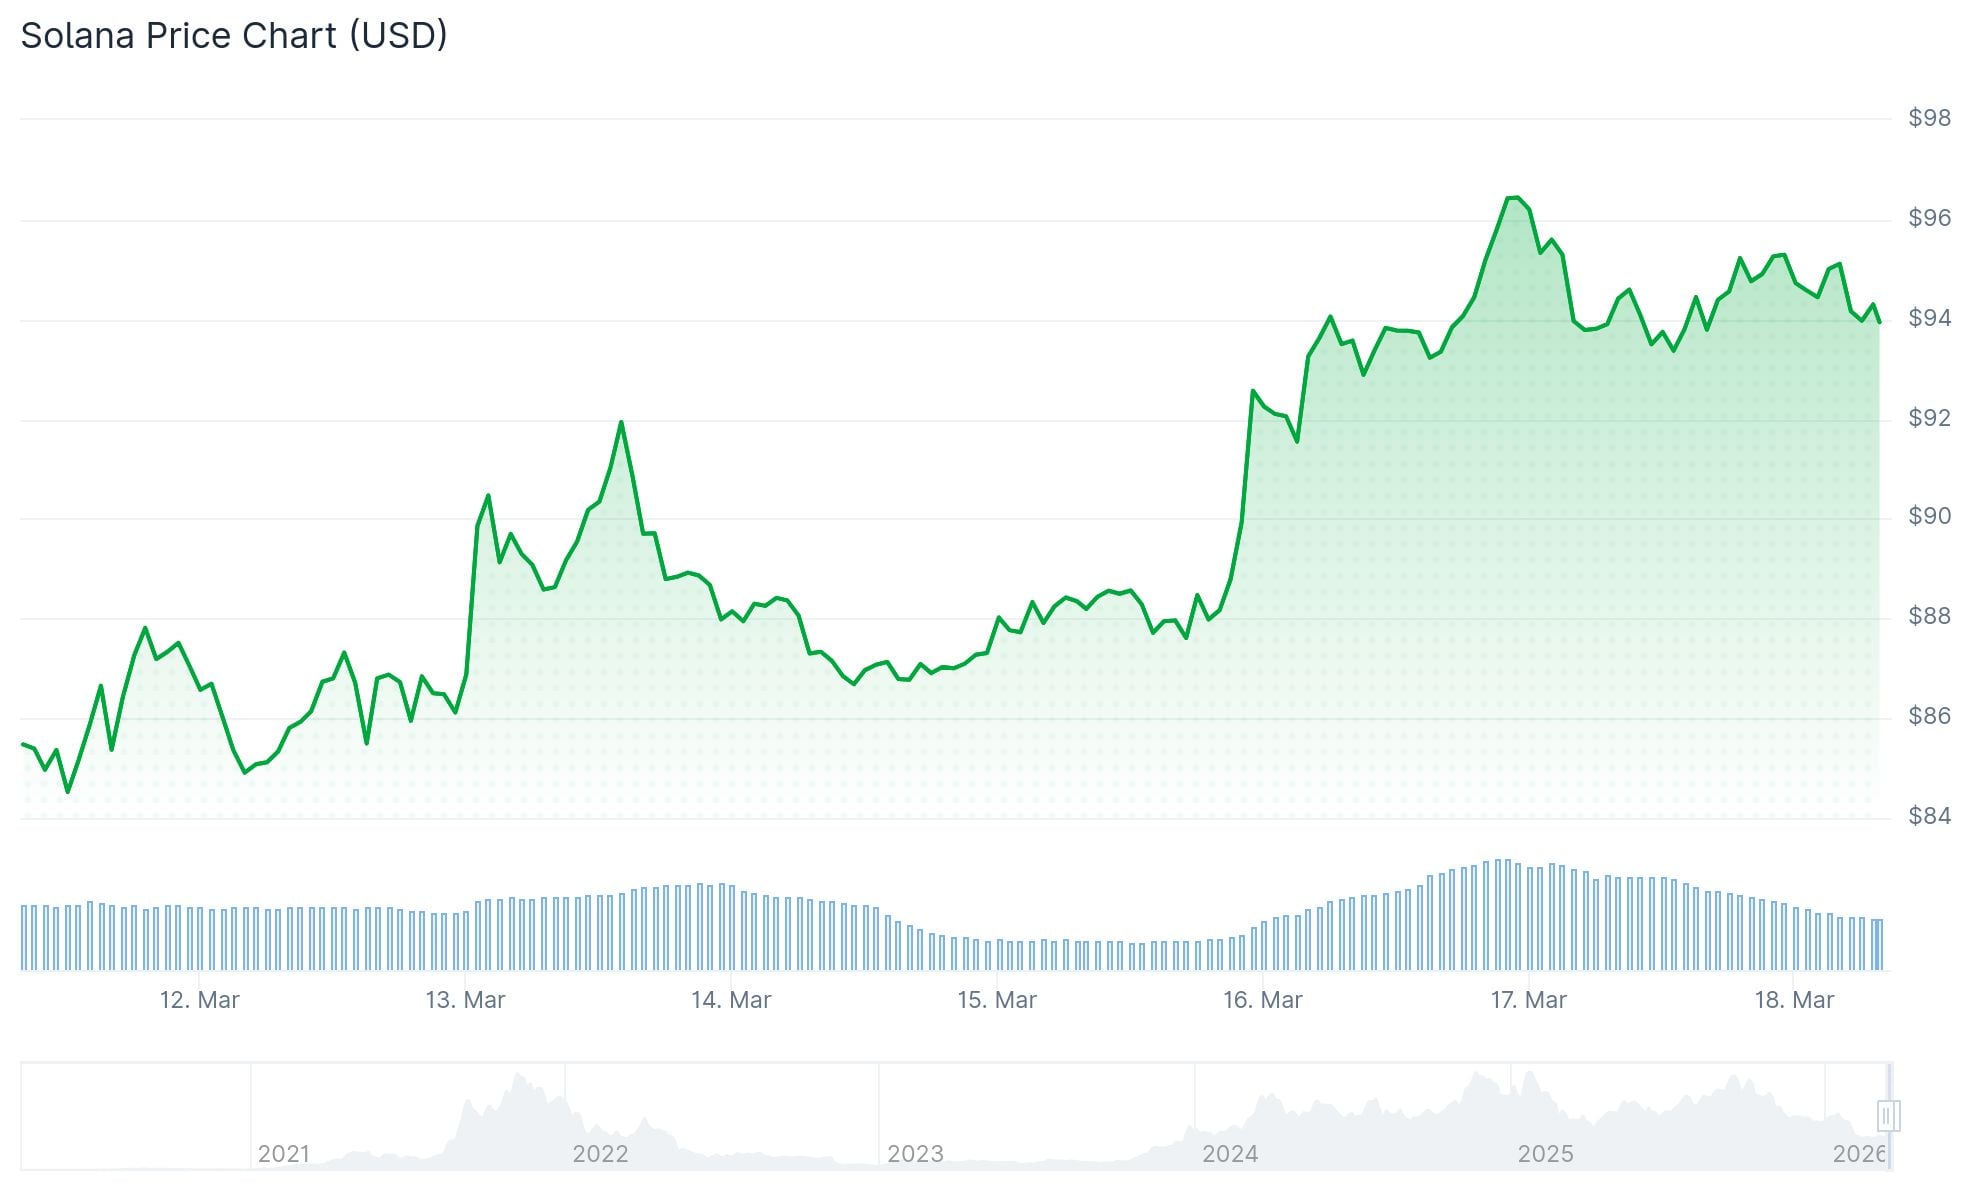
The price recently bounced from the mid-$80 range and is now holding above $93.50. That level had previously acted as resistance, so holding above it is seen as a constructive sign by analysts tracking the chart structure.
Crypto analyst WebTrend has flagged a pattern on Solana’s weekly chart that has appeared only a few times in the past three years. The setup involves consecutive candles with long lower wicks, a structure that suggests sellers are being absorbed by buyers at lower price levels.
URGENT: Solana $SOL is currently confirming a high probability macro setup.
The weekly chart has produced back-to-back bottom candle clusters only 2 times in the last 3 years.
The first signal fired in 2023 and led to a 1,604% rally.
The second signal fired in 2025 and led… pic.twitter.com/0GUl0ffzrf
— WebTrend (@WebTrendCo) March 16, 2026
The same pattern appeared in 2023 before SOL rallied 1,604%. It showed up again in 2025 before a 142% gain. Traders are now watching whether the current setup leads to a similar outcome.
Crypto trader Bluntz pointed to a daily chart breakout from an ascending triangle, where higher lows met a flat resistance zone. The $120 level is the immediate upside target, followed by $145 if that is cleared.
Institutional Flows Back the Move
Spot SOL ETF data from SoSoValue shows $17.81 million in inflows on Tuesday. That followed $2.82 million the day before. The five-day inflow streak began March 10 and reflects growing demand from institutional investors.


Santiment’s Social Dominance metric for SOL reached 1.36% on Wednesday, the highest reading since January 19. That metric tracks how much of crypto media discussion is focused on a given asset.
CoinGlass data shows the long-to-short ratio for Solana sitting at 1.02, meaning slightly more traders are positioned long than short. The RSI on the daily chart is holding near 60, and the MACD line remains above its signal line.
What the Chart Levels Show
The broader weekly chart shows Solana trading in a range between roughly $85 support and $125 resistance. A weekly close above $125 would open the path toward higher levels. The $250 level — the prior all-time high weekly close — sits as the upper boundary of the current cycle.
$SOL chart has some very clean levels.
$125 – next resistance
$250 – prev ATH wkly close
$500 – measured target for c&h break out pic.twitter.com/2mTwArn1rI— Rendoshi 👽🛸 (@Rendoshi1) March 16, 2026
Open interest has stayed below $2.3 billion since the February price low. Futures CVD improved to -$2.8 billion from -$3.5 billion since February 24, showing reduced selling pressure without strong buying demand yet.
The aggregated funding rate has remained neutral, with neither bulls nor bears paying a premium.
SOL ETF inflows have now continued for five straight days, with Tuesday marking the largest single-day figure in that streak at $17.81 million.


