


 Price: Is a Breakout Rally on the Table After $385M in ETF Inflows?")


TLDR
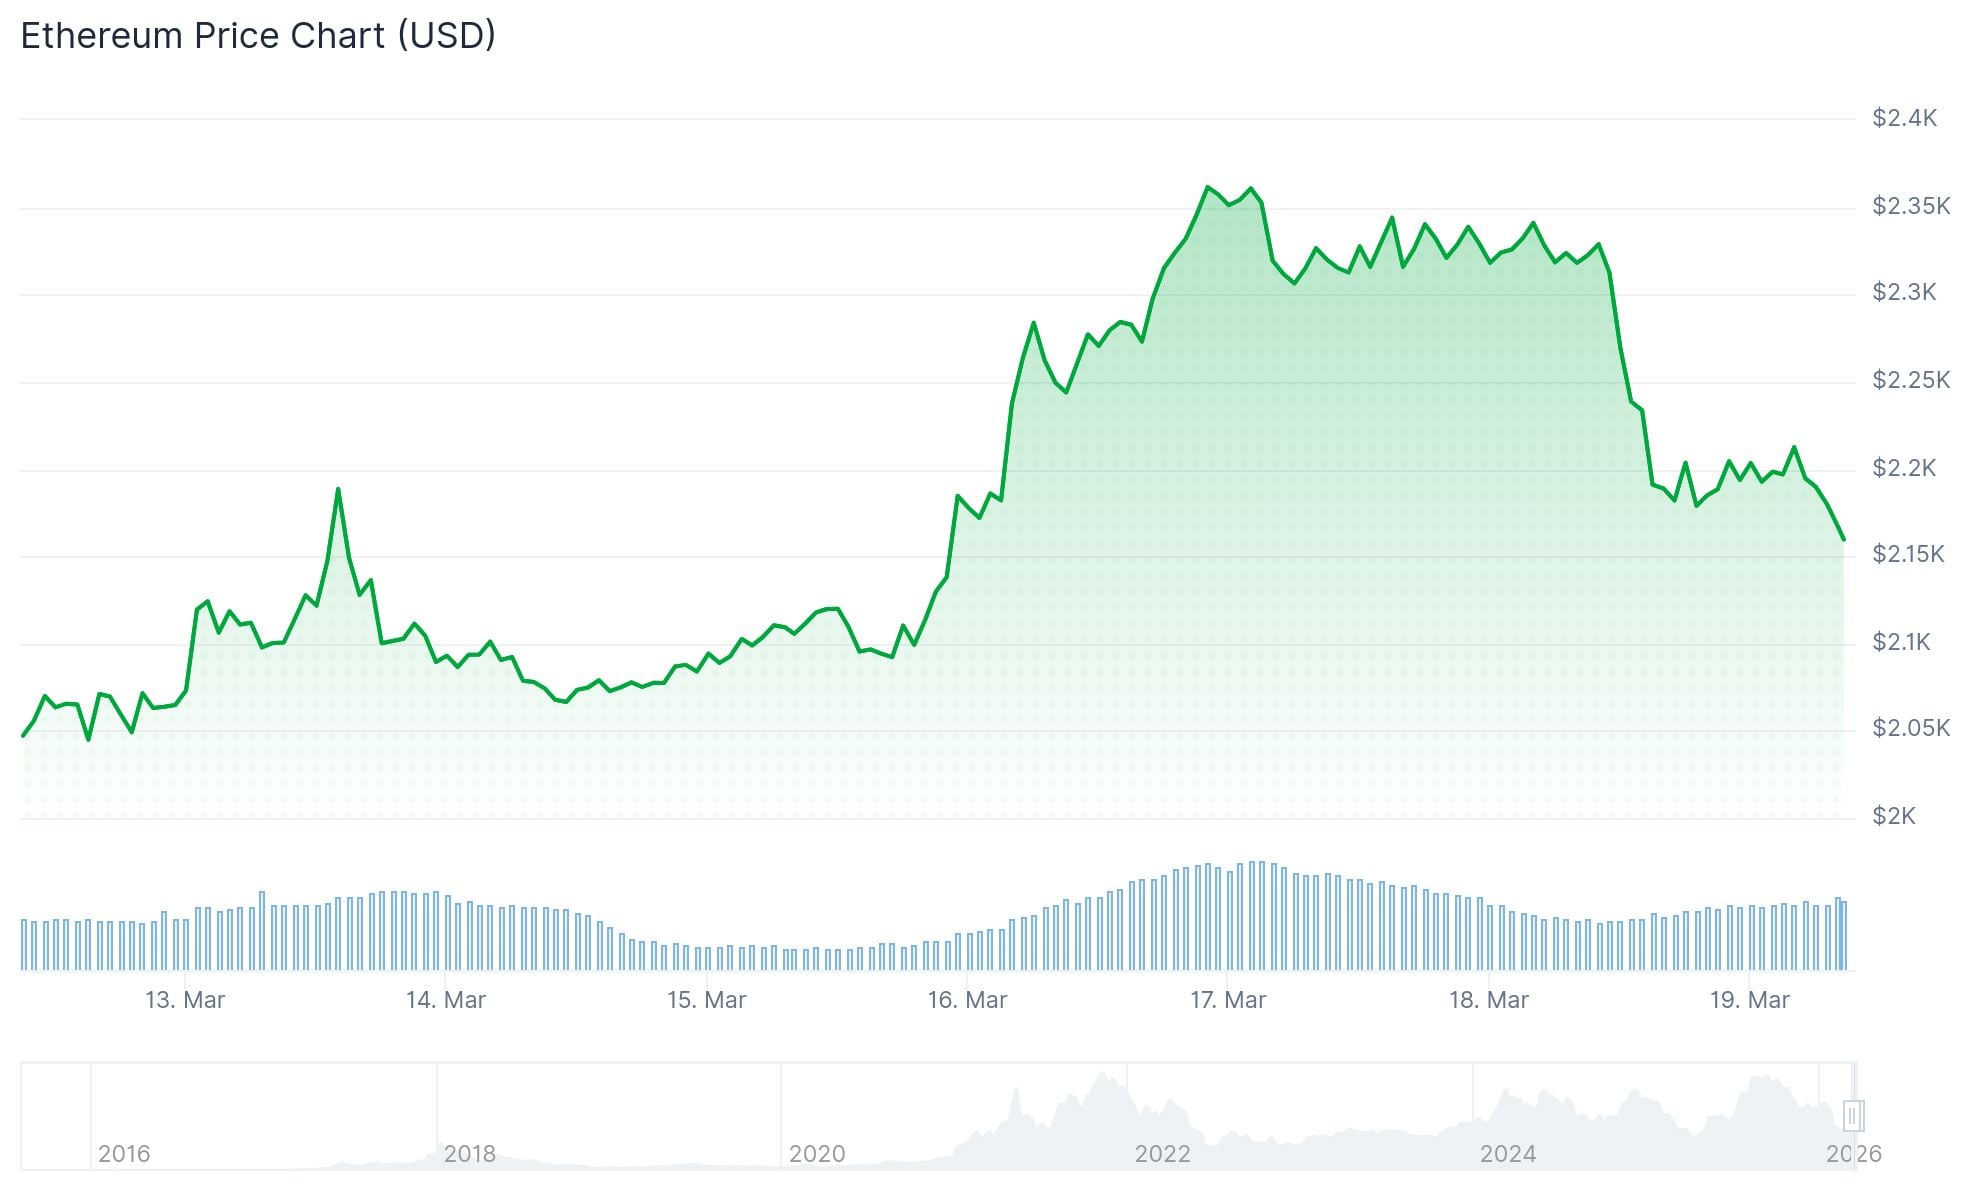
- ETH is trading at $2,160.46, down 1.95% on the day
- Price is above the 50-day moving average of $2,100.87 but well below the 200-day at $3,204.32
- BlackRock’s staked ETH ETF (ETHB) launched in March, adding institutional appeal
- Spot ETH ETFs saw around $385 million in net inflows over a six-day streak in March
- ETH open interest rose roughly 8–9% in a single 24-hour period, now above $30 billion
Ethereum is trading at $2,160.46, down $43.01 on the day, a drop of 1.95%. The session opened at $2,203.46, with a daily range between $2,143.22 and $2,233.69.
The dip follows a multi-week climb from the $2,000 area. Even after today’s decline, ETH is roughly 8–10% above early-month levels. Volume is running light at around 71 million dollars against an average closer to 343 million dollars, pointing to routine profit-taking rather than any panic selling.
ETF Inflows and Institutional Activity
One of the bigger developments this month has been the launch of BlackRock’s iShares Staked Ethereum Trust (ETHB) on Nasdaq. Unlike earlier spot ETH products, this fund wraps staking yield directly into the vehicle, making it more attractive for institutional investors who want exposure to ETH’s income potential.
🚀 Crypto ETF Flows — Bitcoin News
🔹 $BTC: 7D streak | $1.16B total | $199M daily
🔹 $ETH: 6D streak | $138M inflow | $13.75B AUM
🔹 $SOL +$17.8M | XRP +$4.6M
🔹BlackRock IBIT, ETHA lead flows#CryptoSignals #ETFTrading pic.twitter.com/icb14JeOjN— Boominance (@boominance) March 18, 2026
Spot Ethereum ETFs have also seen steady inflows. One session recorded roughly 12.6 million dollars in net inflows, with a single product pulling in more than 10 million dollars. A six-day stretch in March saw around 385 million dollars flow into ETH funds in total.
These flows have helped support price during periods of speculative selling.
Technical Levels
On the daily chart, ETH is sitting above its 50-day moving average of $2,100.87. That level has provided support on recent pullbacks.

My opinion on #Ethereum is the same.
We won't see 1500 until we see 2900.
3350$ ☑️
1850$ ☑️
2950$⌛️
1500$ ⌛️
6100$ ⌛️(September – December) #ETH $ETH pic.twitter.com/kYBBfUS7Ql— Celal Kucuker (@CelalKucuker) March 18, 2026
The 200-day moving average at $3,204.32 is still far above current price, meaning the longer-term trend has not fully recovered.
Key support sits at $2,000–$2,060. Below that, $1,800 is the level that has defined the lower end of the current trading range. On the upside, resistance is clustered at $2,235–$2,380, with a more meaningful breakout level around $2,500.
$ETH is facing resistance around the $2,400 level.
I think a pump above this zone could happen, but now the max pain is to the downside for Ethereum. pic.twitter.com/DRXixUGjr1
— Ted (@TedPillows) March 18, 2026
Ethereum open interest climbed around 8–9% in a single 24-hour period recently, pushing above $30 billion across major venues including Binance, Bybit, and OKX. Derivatives analysts note that rising open interest alongside price gains can accelerate moves in both directions.
ETH has struggled to build sustained acceptance above the $2,300–$2,400 zone. The current structure is one of consolidation, with overlapping price candles and low realized volatility suggesting a larger directional move may be building.
Total market cap for Ethereum stands at approximately $260.76 billion, keeping it firmly in second place among all crypto assets.


