


 Price: Inflows Hit $136M Total as Bearish Wedge Pattern Raises Concern")


TLDR
- Digital asset products saw $230M in inflows last week, led by Bitcoin at $219M
- Solana recorded $17M in inflows for a seventh straight week, totaling $136M
- SOL trades around $91–92, up 5.64% in 24 hours but down 3% over the past week
- A rising wedge pattern on the 3-day chart signals potential for another drop
- Key levels to watch: $78 support and $95 resistance, with $65–70 as a downside target
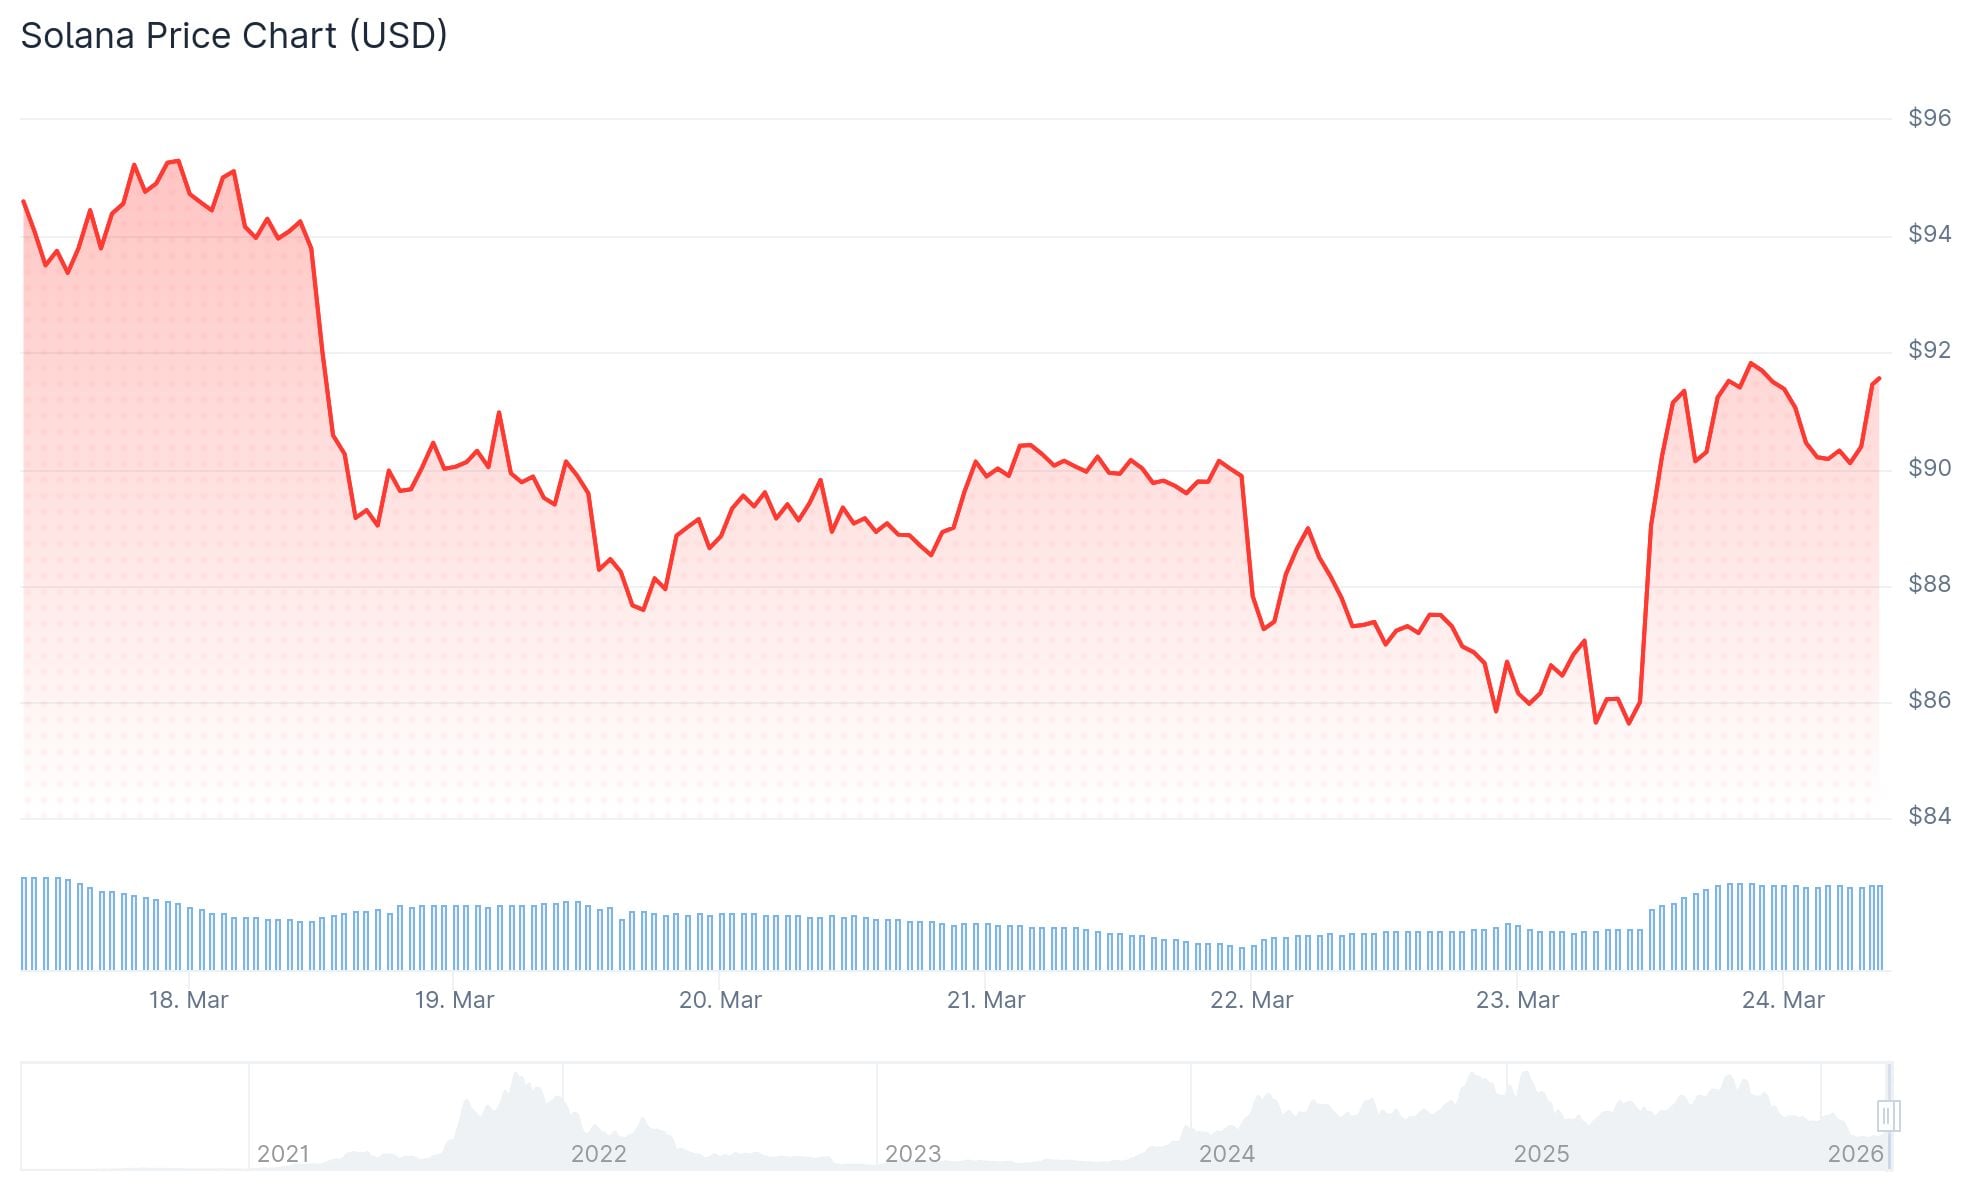
Solana (SOL) is trading in the low $90s after a modest recovery, but technical signals are raising questions about whether the move can hold.
Digital asset investment products saw $230M in total inflows last week, according to CoinShares data. Early-week flows were strong at $635M, but sentiment shifted after the Federal Reserve’s meeting, leading to $405M in mid-week outflows.
From March 16 to March 20 (ET), Bitcoin spot ETFs recorded net inflows of $95.18 million, marking four consecutive weeks of net inflows. Ethereum spot ETFs saw net outflows of $59.94 million. SOL spot ETFs recorded net inflows of $21.10 million, while XRP spot ETFs saw net… pic.twitter.com/oI6NJjhwZl
— Wu Blockchain (@WuBlockchain) March 23, 2026
The US led regional inflows at $153M. Germany added $30.2M and Switzerland contributed $27.5M.
Bitcoin attracted the bulk of inflows at $219M. Ethereum saw $27.5M in outflows, snapping a three-week positive streak.
Solana pulled in $17M last week, its seventh consecutive week of inflows. That brings the total to $136M over that stretch.
SOL was priced at $91.61 at time of writing, up 5.64% in 24 hours. Despite the daily gain, the coin is still down around 3% over the past seven days.

Bearish Wedge Raises Red Flags
Analyst CryptoBullet flagged a rising wedge pattern forming on the 3-day SOL chart. This pattern appeared after Solana dropped below its 200-week moving average, a level often used to gauge long-term trend direction.
$SOL 3D chart
This Rising Wedge looks horrendous
Most likely it will be resolved to the downside 📉
(Trend continuation) pic.twitter.com/0mN75G0KVK— CryptoBullet (@CryptoBullet1) March 22, 2026
Each bounce within the wedge is weaker than the last. That suggests buyers are struggling to keep up momentum. A rising wedge after a large decline often signals the downtrend will resume.
If SOL breaks below the wedge base, a sharper drop could follow. Analyst DrBullZeus places support at $78, with a breakdown potentially targeting $65–70.
Weekly Chart Shows Mixed Signals
On the weekly chart, the 100 and 200 EMAs are still trending upward, which is a positive long-term sign. However, the 20 and 50 EMAs have flattened, pointing to slowing momentum.
Bollinger Bands are tightly compressed, which typically precedes a large move in either direction. The RSI sits in the mid-30s — not oversold, but showing sellers are in control.
The MACD line remains in bearish territory, though histogram bars are shrinking, hinting that selling pressure may be easing slightly.
Chainlink and Hyperliquid also saw smaller inflows of $4.6M and $4.5M respectively last week.
On the upside, a break above $95 could push SOL toward $110–$120. Longer-term projections from analyst Moonbag point to $260–$300 if SOL reclaims the $180–$200 zone.
The Balance of Power indicator is currently negative, with sellers holding the edge as of the latest data.


