


 Price: SuperTrend Turns Bullish for First Time Since May 2025")


TLDR
- ETH rallied 9% on Monday but stalled at $2,200, which is acting as key resistance
- The 50-day EMA at $2,200 is resistance; the 50-day SMA at $2,000 is support
- Spot ETH ETF flows have turned negative again, with over $27.5 million in net outflows in the week ending March 20
- A break above $2,200 could trigger a measured target of $3,080 based on a symmetrical triangle pattern
- The SuperTrend indicator on the daily chart has turned bullish (green) for the first time since May last year
Ethereum’s recent price recovery ran into a wall at $2,200 on Monday, even as a technical indicator flashed its first bullish signal in nearly a year.
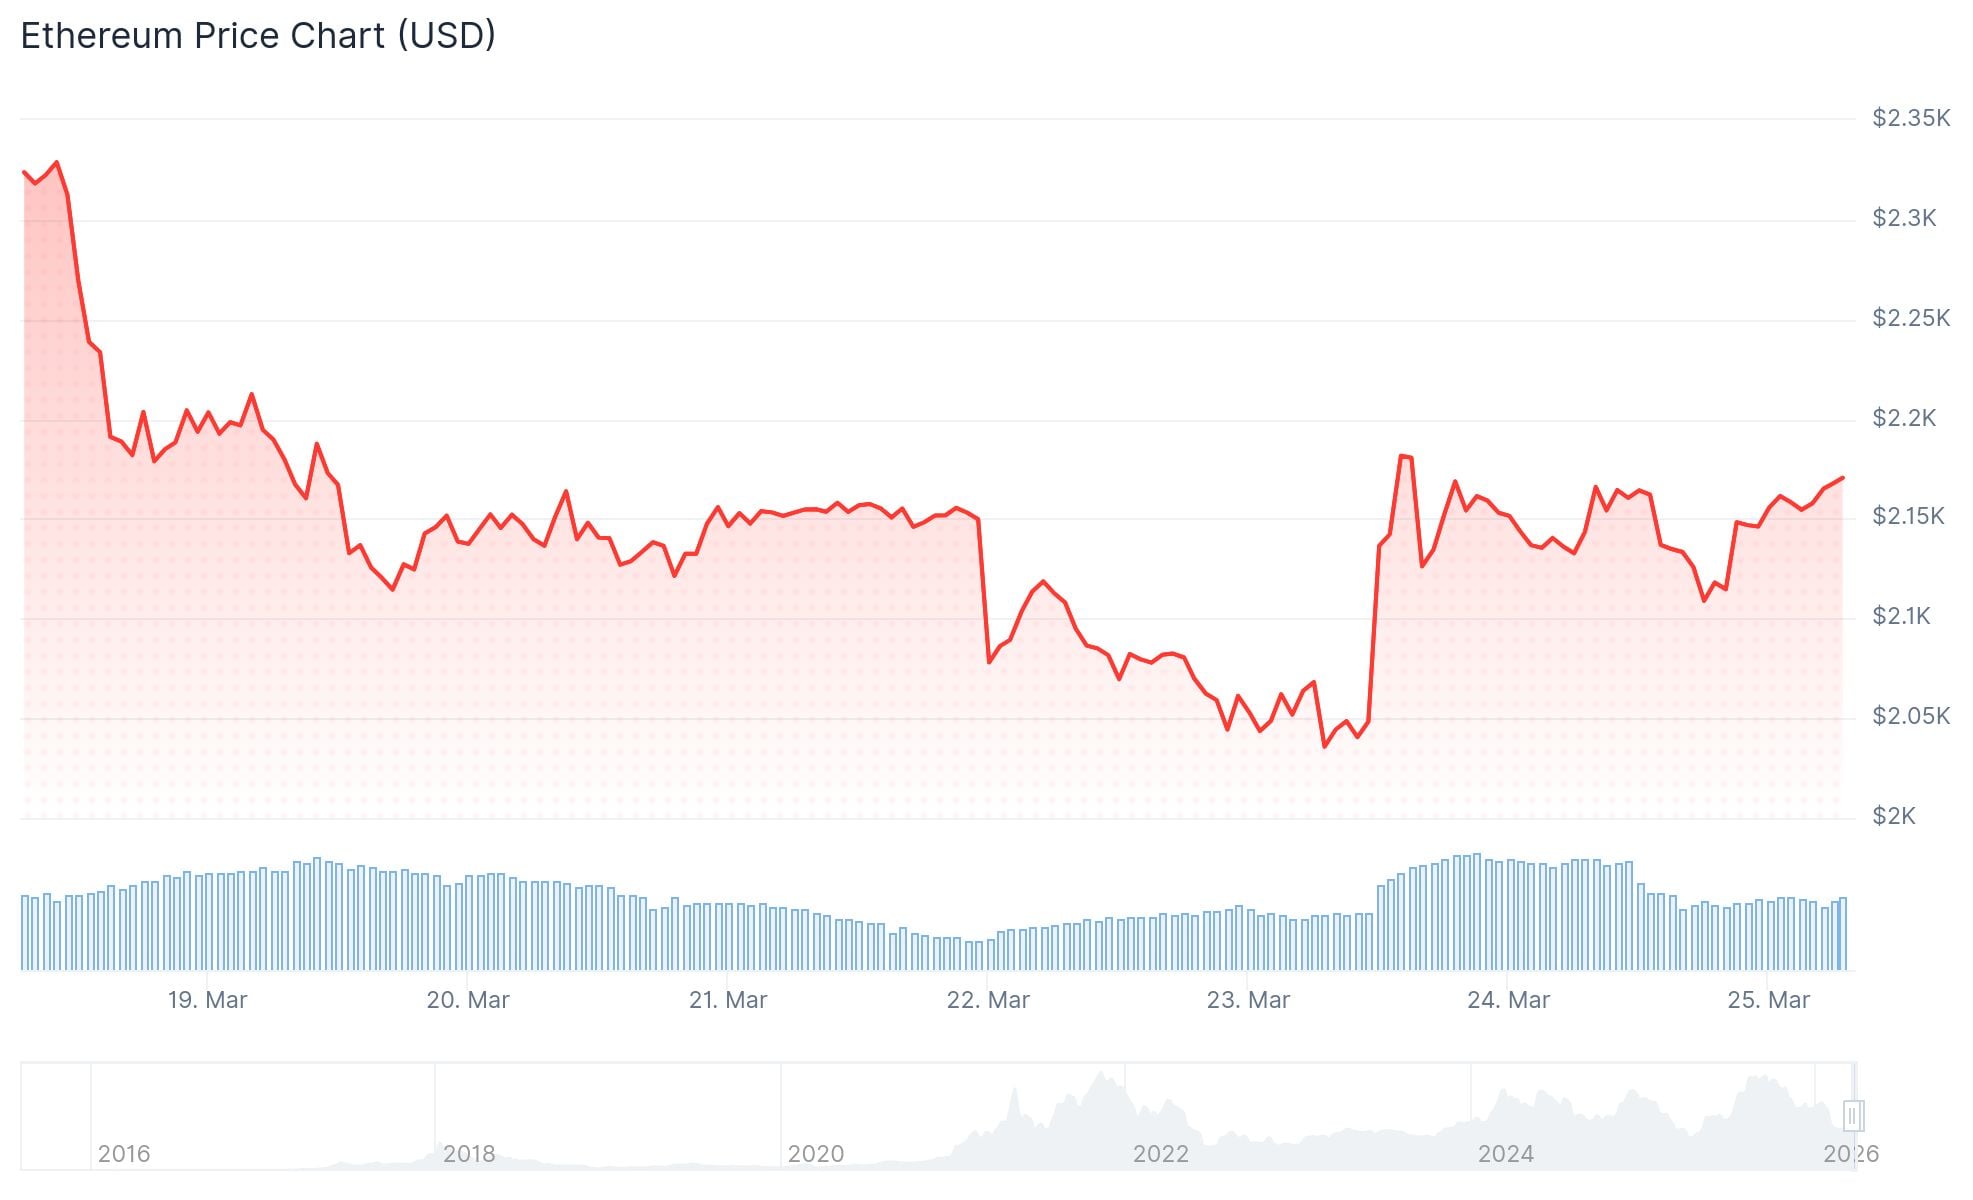
ETH climbed around 9% on Monday but could not push through the $2,200 level. That level sits right at the 50-day exponential moving average (EMA), which is acting as overhead resistance.
Price is currently trading above $2,120 and above the 100-hourly simple moving average. It has also broken above a short-term bearish trend line that had been holding at $2,145 on the hourly chart.
Key Price Levels to Watch
The immediate resistance levels are $2,180 and then $2,200. Above that, the next targets would be $2,250, $2,300, and $2,345.
$ETH has reclaimed the $2,150 level.
This is because the market expects a US-Iran ceasefire and is now pricing it.
During a downtrend, most peaks happen on good news, and the same will happen with Ethereum. pic.twitter.com/fB0Ij8XL5c
— Ted (@TedPillows) March 24, 2026
If ETH can close above $2,200 cleanly, the symmetrical triangle pattern on the daily chart points to a measured target of $3,080, a roughly 42% move from current levels.
However, before reaching that level, bulls would face heavy resistance between $2,780 and $2,880. That zone is where the 200-day EMA, 50-week EMA, and 100-week EMA all converge. Glassnode data shows more than 7.5 million ETH was accumulated by investors in the $2,750–$2,850 range.

On the downside, if $2,000 fails to hold as support, analyst Ted Pillows noted in a post on X: “Now, the only crucial support level for Ethereum is $2,000 and if ETH loses it, the dump will accelerate to new lows.” The bearish triangle target sits at $1,400.
ETF Flows Still a Drag
One of the main headwinds for ETH right now is institutional demand. Spot ETH ETF flows have turned negative again after a brief period of inflows. The 30-day average of US spot ETH ETF flows has drifted back into negative territory.
Global Ethereum investment products saw over $27.5 million in net outflows in the week ending March 20.
The number of companies buying ETH as a treasury asset has also dropped sharply since August 2025. The one exception is Bitmine Immersion Technologies, led by Tom Lee, which added $139 million in ETH last week. Bitmine now holds 4.66 million ETH, moving closer to its stated goal of acquiring 5% of circulating supply.
Momentum is finally shifting back to the Ethereum $ETH bulls. The SuperTrend on the daily chart has turned green (bullish) for the first time since May last year.
This suggests the long period of "sideways grind" is ending, and as long as the $1,800 support holds, a new uptrend… https://t.co/BDiUteQrYS pic.twitter.com/dmlRyOETGB
— Ali Charts (@alicharts) March 24, 2026
On a more positive note, crypto analyst Ali Charts posted on X: “Momentum is finally shifting back to the Ethereum $ETH bulls. The SuperTrend on the daily chart has turned green (bullish) for the first time since May last year. This suggests the long period of ‘sideways grind’ is ending, and as long as the $1,800 support holds, a new uptrend could begin.”
Bitmine remains the only corporate buyer actively adding to its ETH position, with total holdings now at 4.66 million ETH.


