


TLDR
- XRP is trading around $1.32–$1.35 as multiple technical indicators hint at a cycle bottom
- The weekly RSI hit an oversold level of 29 on March 2, now recovering to 34
- The MACD has dropped to its lowest-ever level and is close to printing a bullish cross
- Nearly 500 million XRP were acquired around the $1.30 level, making it a key support zone
- If $1.27–$1.30 breaks, the next support sits at $1.15–$1.12, with a worst-case target of $0.80
XRP has been in a downtrend for eight months. But right now, several technical indicators are starting to line up in a way that has historically marked a market bottom for the token.
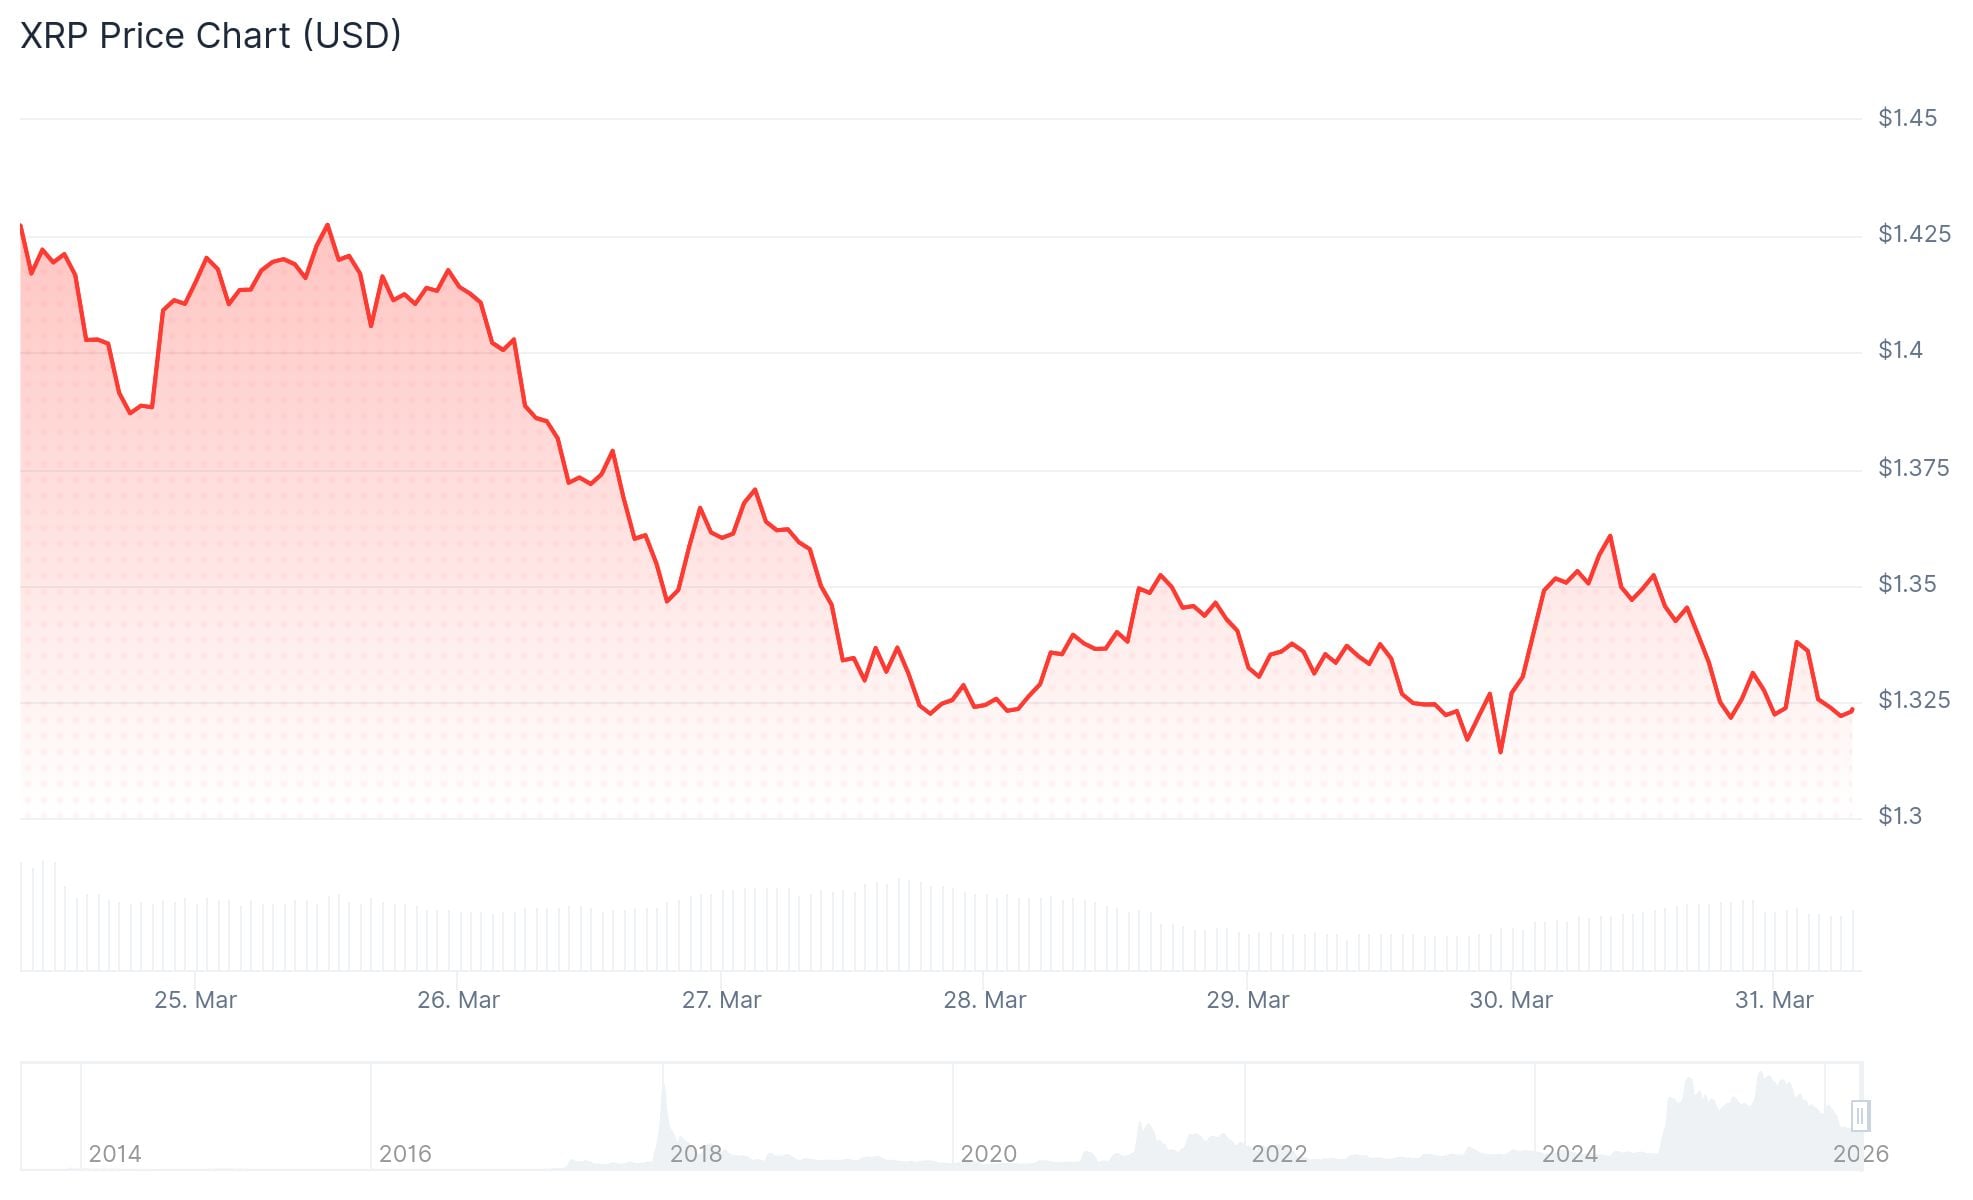
XRP is currently trading at around $1.32 to $1.35. Traders are closely watching whether bulls can hold the $1.30 support zone.
The weekly RSI dropped to 29 on March 2, which is considered oversold territory. It has since recovered to 34. Historically, when XRP’s RSI has reached these levels, it has preceded strong price recoveries.
The MACD indicator has also fallen to its lowest level ever recorded for XRP. It is now close to printing a bullish cross, which is a signal that has marked macro bottoms for XRP in the past.
When both signals — an oversold RSI and a MACD bullish cross — have appeared together before, XRP rallied between 74% and 230%. That was seen in 2022 and again in mid-2024.
Key Support at $1.30
Analyst Egrag Crypto described the $1.30 area as “a very sensitive level” where “the market chooses direction.” He said that if the zone holds, price could grind higher, but a break below could lead to a revisit of $1.15.
#XRP – This Is Where It Decides ⚖️:
We’re sitting at a very sensitive level… this is where the market chooses direction.
🔼If this zone holds, we grind higher.
🔽If it breaks, we likely revisit deeper support around $1.15.🟡Historical behavior matters:
In the previous cycle,… pic.twitter.com/6DAyXHpOnQ— EGRAG CRYPTO (@egragcrypto) March 27, 2026

On-chain data from Glassnode shows that nearly 500 million XRP were acquired around the $1.30 price level. That concentration of cost basis creates a strong floor of buyer interest.
Below $1.30, the next support zone sits at $1.15 to $1.12, where the 200-week simple moving average is located. A drop below that level would open the door to the bear flag target of $0.80.
Analyst Arthur posted on X that the weekly RSI on XRP had hit one of its lowest levels in years, asking whether the chart was “flashing a long-term bottom signal.” Analyst Cryptoinsightuk noted this is only the second time XRP has been oversold on the RSI, with the first being July 2022 — which marked the exact bottom.
XRP vs Bitcoin Ratio
XRP is also beginning to stabilize against Bitcoin near the bottom of a long consolidation range. The last time XRP bottomed against BTC at this level was June 2025, which kicked off a 56% rise in the XRP/BTC ratio and a 92% rally in XRP price to $3.66.
190 million $XRP have been accumulated by whales over the past week. pic.twitter.com/8B8lffm3qV
— Ali Charts (@alicharts) March 30, 2026
On-chain data shows whale accumulation is also picking up. According to analyst Ali Charts, 190 million XRP were accumulated by whales in the past week alone. Exchange outflows have also been elevated, which typically indicates longer-term holding behavior.
To confirm a reversal, bulls need to push XRP above the $1.61 range high.


