


TLDR
- XRP is trading around $1.33, holding support near $1.30–$1.35 after a drop from $2.40 earlier this year
- Binance outflow transactions have surged since late February, with some days seeing up to 6,000 withdrawal events
- Withdrawals are concentrated in the 1,000–100,000 XRP range, pointing to mid-sized investors moving coins to private wallets
- XRP remains below its 50, 100, and 200-day moving averages, with $1.50 acting as key resistance
- Analyst Ali Charts flagged a possible ascending triangle pattern that could signal a buying opportunity
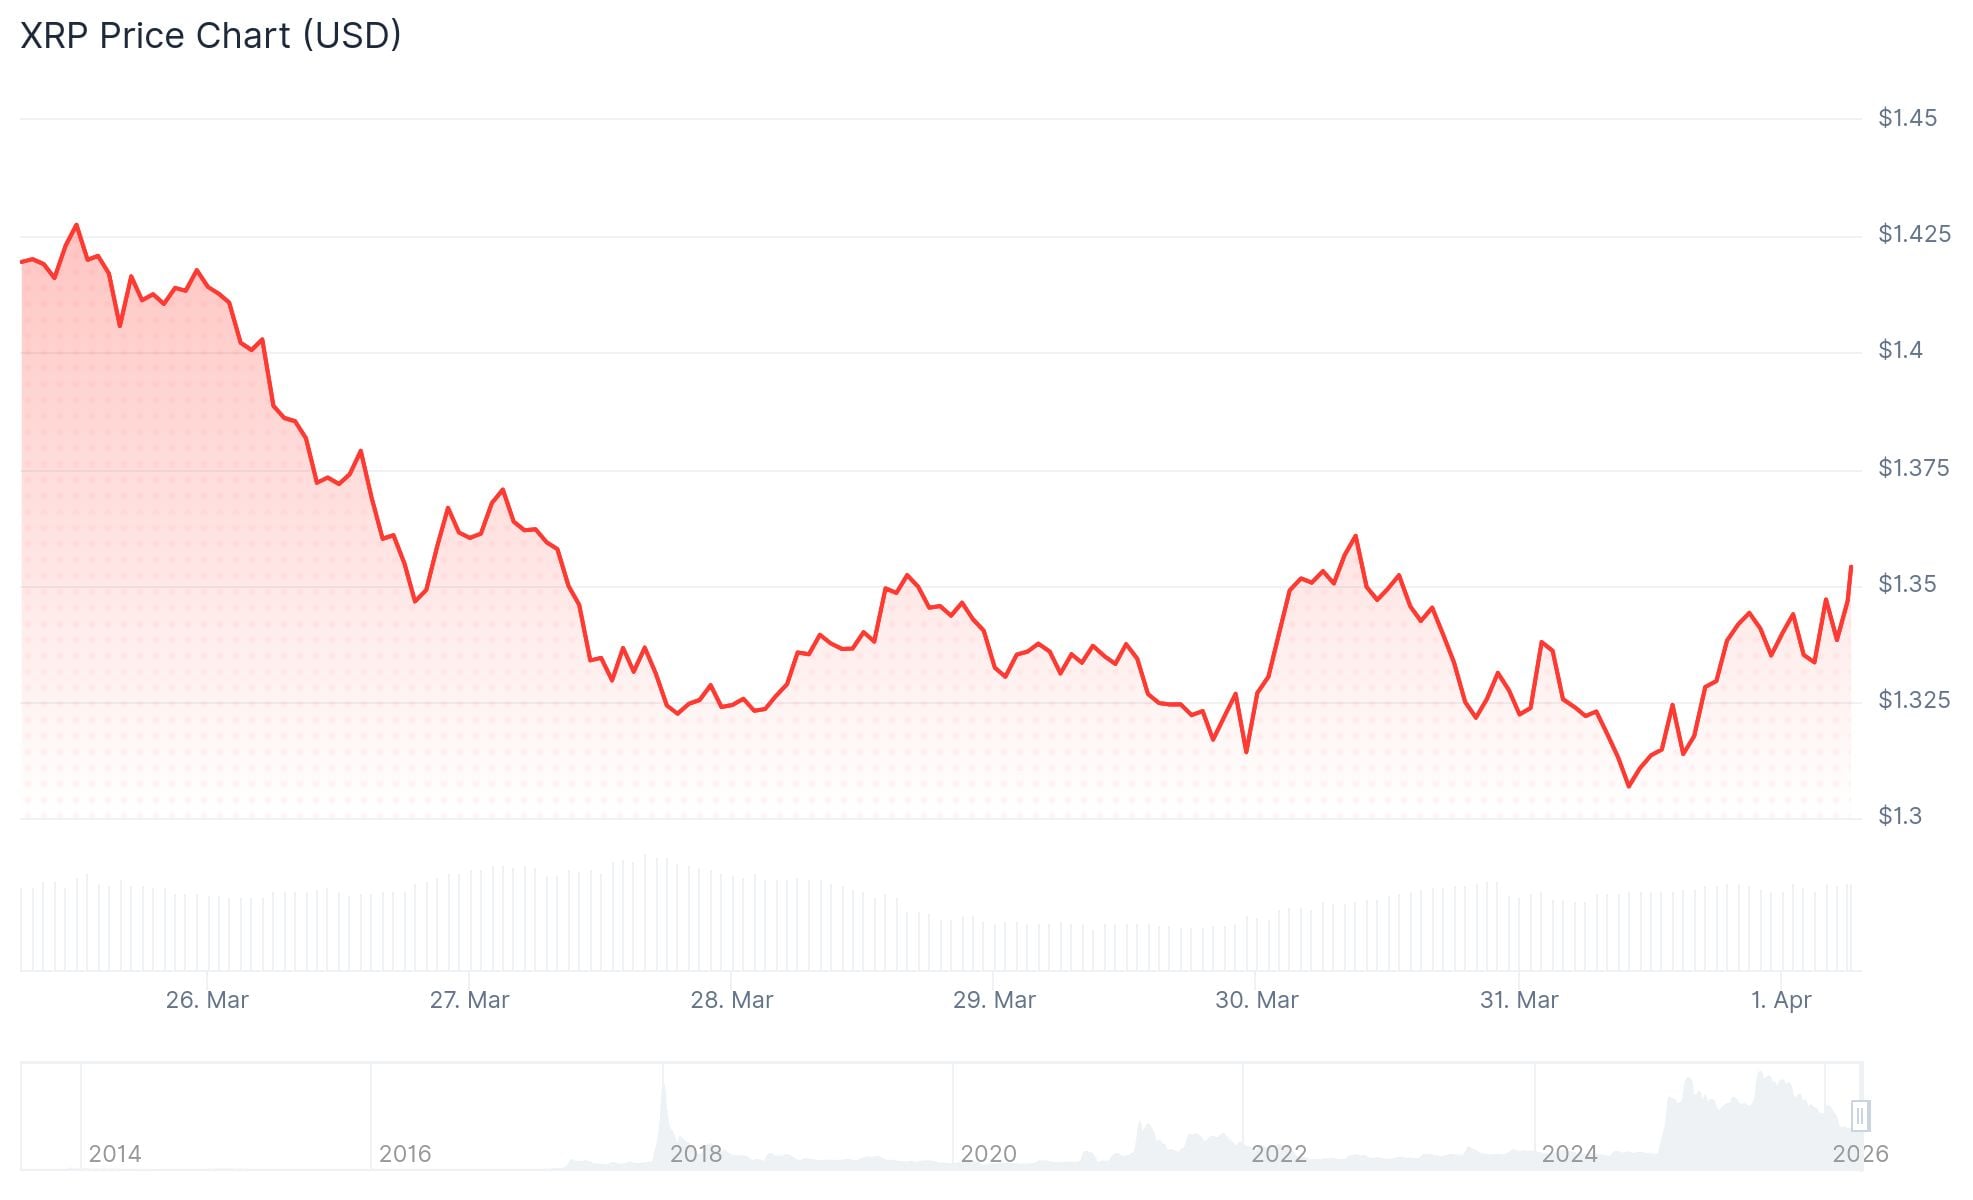
XRP is currently trading at $1.33, holding above a key support level near $1.30 after months of steady decline from highs around $2.40. The price has stayed within a $1.30–$1.50 range for several months, even as many other altcoins have fallen to or near all-time lows.
XRP is still more than 60% below its all-time high. The broader trend remains bearish, with price sitting below the 50, 100, and 200-day moving averages — all sloping downward.
The RSI sits near 41 on the daily chart, showing weak momentum. The MACD line is just below the signal line near zero, pointing to fading buying attempts rather than a strong reversal.
Despite the bearish chart structure, on-chain data from analyst Darkfost tells a different story. Since late February, XRP outflow transactions on Binance have surged. Multiple days have recorded over 4,000 withdrawal events, with single-day peaks near 6,000.

Binance Outflows Signal Quiet Accumulation
These are not large, single whale movements. The activity is spread across thousands of individual transactions in the 1,000–100,000 XRP range — a bracket tied to mid-sized, retail, and semi-institutional investors.
This pattern suggests investors are pulling XRP off exchanges and into private wallets. Removing coins from exchange supply reduces available selling pressure over time.
Darkfost describes this as consistent with a gradual accumulation phase rather than distribution. The coins are leaving, and they are not coming back to the order books.

The $1.25–$1.30 zone has been tested multiple times without breaking down. Buyers appear to be absorbing sell pressure at this level, which is a structural shift from the earlier freefall.
Key Levels to Watch
Resistance at $1.50 has capped every rally attempt since February. A break above that level would be the first sign of a potential recovery. Stronger resistance sits near $1.81, the upper boundary of the current descending channel.
On the downside, losing $1.25 would expose the $1.00 area as the next major support level.
If $XRP is following this ascending triangle, it could offer a short-term buying opportunity and a strong long-term uptrend. pic.twitter.com/q9RbslAUUU
— Ali Charts (@alicharts) March 31, 2026
Analyst Ali Charts posted on X that if XRP is forming an ascending triangle pattern, it could offer a short-term buying opportunity and signal a stronger long-term uptrend.
XRP price was last recorded at $1.33 on Wednesday, April 1, 2026.


