


 Price: Bollinger Band Squeeze and Whale Accumulation Signal Possible Breakout")


TLDR
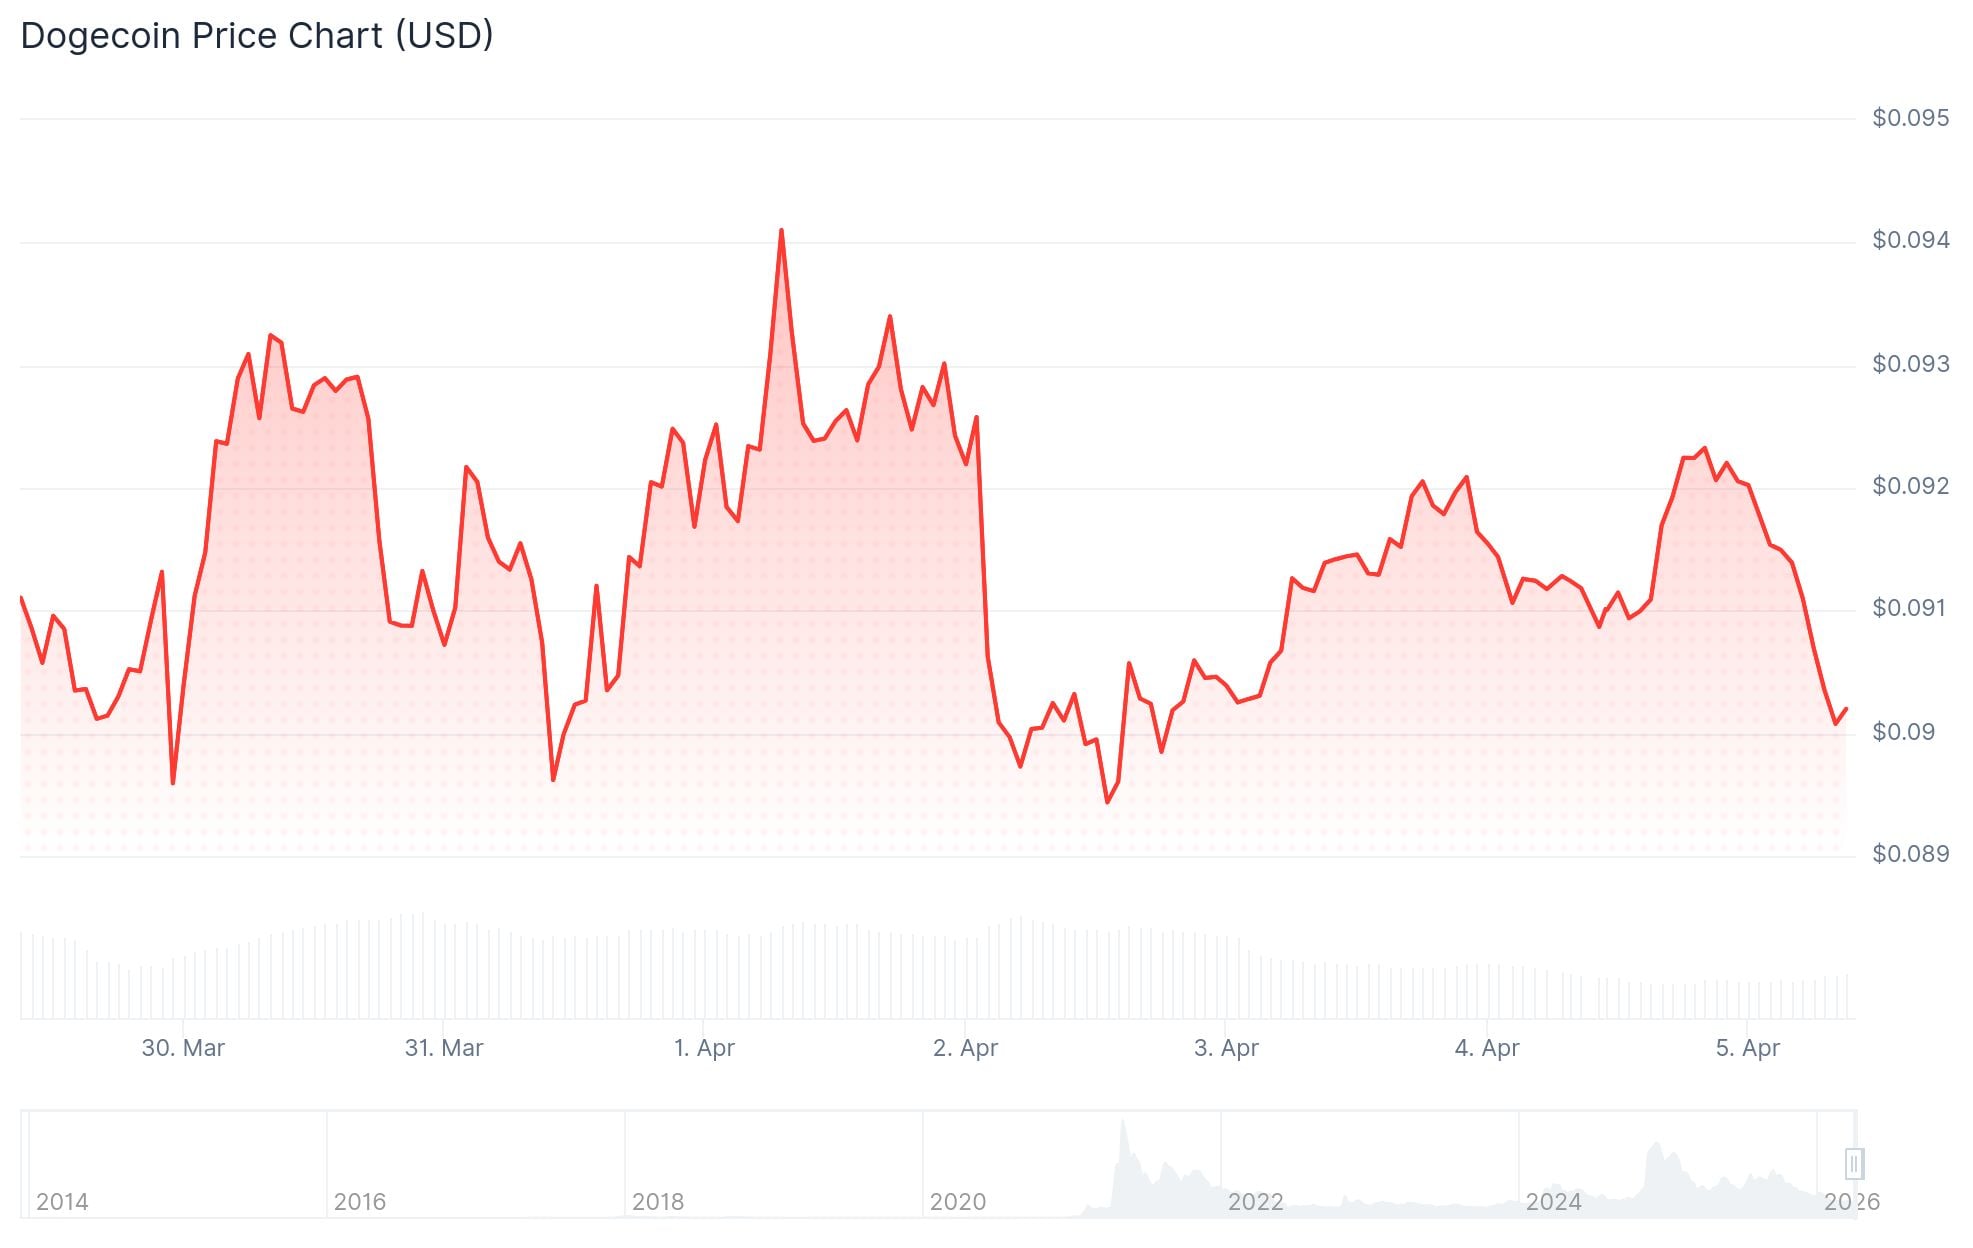
- Dogecoin is trading around $0.091, down over 5.5% in the past 30 days, with trading volume falling roughly 25% to around $530–$543 million in 24 hours.
- A Bollinger Band squeeze on the daily chart is forming, which has historically preceded major volatility spikes.
- Crypto whales have quietly accumulated over 500 million DOGE since March 31, 2026, during the current sideways price period.
- A daily candle close above $0.095 could trigger a 26% price surge, while a break below $0.08821 could send DOGE toward $0.055.
- Bulls currently dominate in the derivatives market, with $11.61 million in long positions vs $9.21 million in shorts at key liquidation levels.
Dogecoin is stuck in a tight range right now, sitting around $0.091 after weeks of back-and-forth price action. The meme coin has dropped more than 5.5% over the past 30 days, and trading volume has dried up by about 25%, sitting near $530–$543 million over a 24-hour period. That drop in volume suggests many traders are sitting on the sidelines.
Despite the slow price action, one thing stands out: whales are buying.
Since March 31, 2026, large holders have quietly accumulated over 500 million DOGE. This happened while the price was bouncing between $0.087 and $0.101, a range it has been stuck in for over a week. The buying from big players at these levels has caught the attention of analysts watching the asset.
Whales are buying Dogecoin $DOGE!
Since March 31, whales have quietly scooped up over 500 million DOGE. This massive accumulation is happening while the price is trapped in a tight range between $0.087 and $0.101.
The daily chart is now showing a classic Bollinger Band Squeeze,… https://t.co/0cSDTokybI pic.twitter.com/DaISxAXGHm
— Ali Charts (@alicharts) April 3, 2026
A crypto analyst shared this data on X, pointing out that the accumulation pattern is pairing with a classic Bollinger Band Squeeze on the daily chart. Historically, this type of squeeze — where price volatility compresses into a tight band — often precedes a large move in either direction.
Key Price Levels to Watch
On the daily chart, DOGE is forming what looks like a descending triangle. The pattern is narrowing, meaning a breakout — up or down — may be coming soon.
The upside case is clear: if DOGE closes a daily candle above $0.095, analysts say a 26% price jump becomes possible. That would put the price near $0.119. The Bollinger Bands analysis also points to a potential move toward $0.108972 if buying pressure picks up.

Bollinger Bands are squeezing on Dogecoin $DOGE daily chart, suggesting a major price move could be coming soon. pic.twitter.com/AO6dfMzKkE
— Ali Charts (@alicharts) April 1, 2026
But there is also a downside risk. If DOGE breaks below $0.08821, the next major support sits much lower at around $0.055.
The Average Directional Index (ADX) is currently at 13.69, well below the key 25 threshold. That signals weak trend strength and no clear direction in the market just yet.
Derivatives and Sentiment
In the futures market, bulls have a slight edge. Data from CoinGlass shows $11.61 million in long positions versus $9.21 million in shorts clustered around the key liquidation levels of $0.0895 and $0.0932. Open Interest has dropped slightly by 0.75%, pointing to some cooling in activity.
Some traders are watching April with interest. Historically, April has been a strong month for DOGE. In 2021, the meme coin surged 531% during the same period, eventually reaching $0.453. While past performance does not guarantee future results, it is a data point some market participants are keeping in mind.
At the time of writing, DOGE is trading at $0.091 with low volume and a compressed volatility pattern. The next significant move will likely depend on whether that daily candle closes above $0.095.


