


 Price: New Breakout or Fake-Out? What the Charts Are Saying Right Now")


TLDR
- ETH broke above the $2,150–$2,200 resistance zone and is trading near $2,214
- Analyst Ted Pillows warns new lows are still possible in Q2 or Q3 2026
- ETH open interest jumped to 14 million ETH following a US-Iran ceasefire deal
- Short liquidations have outpaced long liquidations since the start of the month
- Key support sits at $2,120; a break below could push ETH toward $2,080 or lower
Ethereum is trading above $2,200 after breaking out of a key resistance zone. Futures data shows growing bullish positioning, but analysts are not calling this a full trend reversal yet.
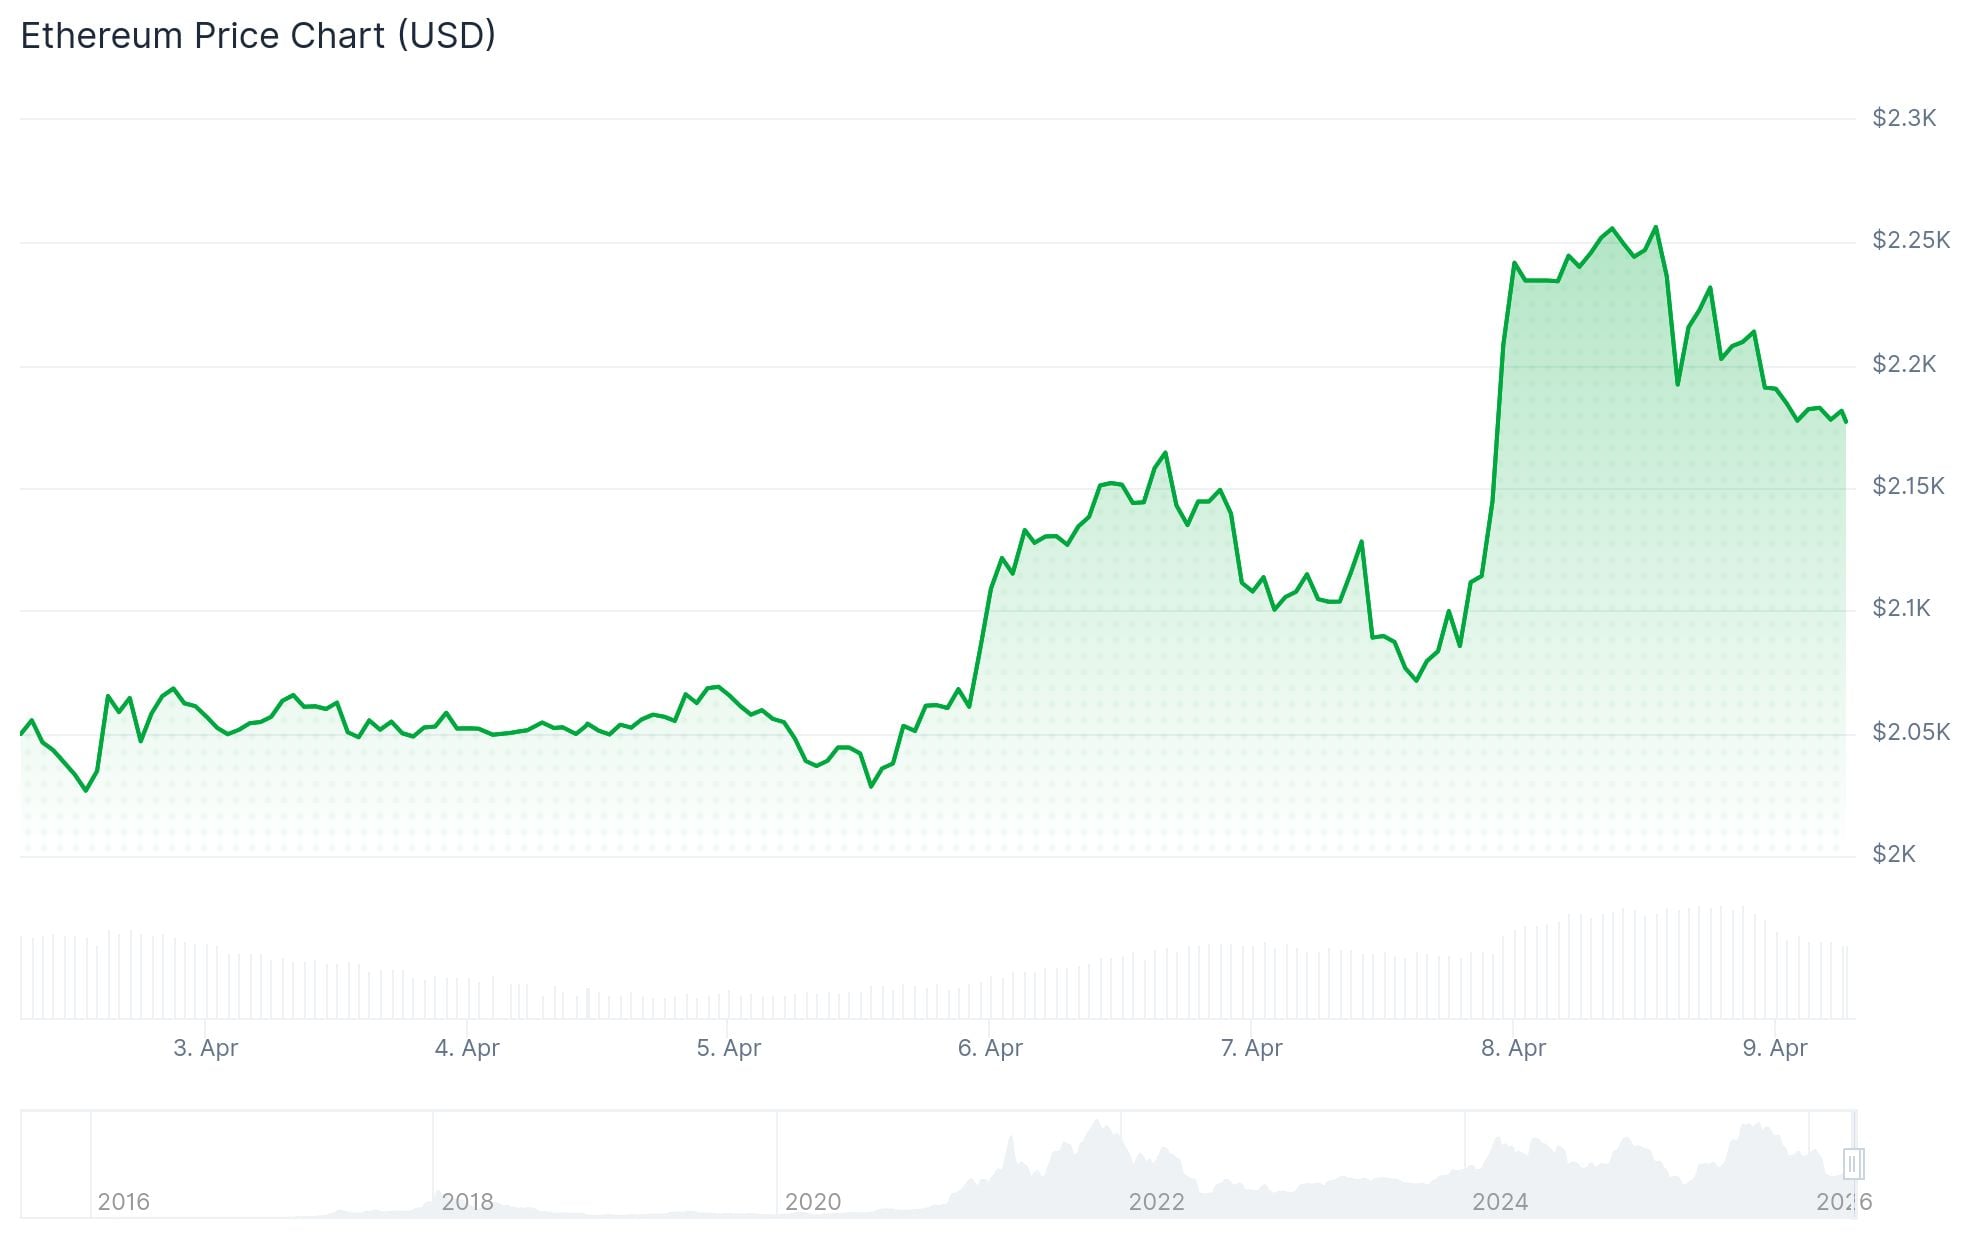
ETH climbed above the $2,165 and $2,200 levels, reaching a high of $2,274 before pulling back. The price is currently hovering around $2,214, holding above its 20-day and 50-day Exponential Moving Averages (EMAs) at $2,110 and $2,152.
Analyst Ted Pillows shared a chart on X showing ETH breaking above the $2,150–$2,200 resistance band. He identified $2,400.73 and $2,624.07 as the next resistance levels if ETH holds above the breakout zone.
$ETH has broken above the $2,150-$2,200 resistance zone.
As long as Ethereum is holding above the $2,200 level, it could make a move towards its last month's top.
But don't mistake it for the start of a bull run.
New ETH lows are coming in Q2/Q3 2026. pic.twitter.com/i5zY2racko
— Ted (@TedPillows) April 8, 2026
Pillows cautioned that the move does not confirm a new bull run. He said new lows could still come in Q2 or Q3 2026, meaning the current rebound may be a temporary recovery inside a larger downtrend.
The $2,200 level is the key line to watch. If ETH holds above it, bulls may target $2,400 and then $2,624. If it slips back below, lower support zones around $1,750–$1,800 come back into play.
Futures Market Activity Picks Up
X user CW posted data showing ETH futures inflows are rising again. Net long positions and open interest are both climbing, which suggests traders are adding fresh bullish exposure.

Open interest jumped to 14 million Ethereum on Wednesday, recovering from a downtrend that started on March 28 when OI dropped by roughly 1.55 million ETH. The Taker Buy Sell Ratio also rose, showing long traders are dominating perpetual swap markets.

Short liquidations have outpaced long liquidations since the start of the month, which points to a gradual shift toward bullish dominance in derivatives.
US-Iran Ceasefire Adds Macro Pressure
The spike in open interest followed a US-Iran two-week ceasefire deal. However, Iran’s parliamentary speaker Mohammad Bagher Ghalibaf stated Wednesday that the US violated the deal following continued Israeli attacks in Lebanon and a drone entering Iranian airspace.
US oil prices rebounded from $91 toward $96 following the statement. Rising oil prices have weighed on top crypto assets over the past month.
On the hourly chart, a declining channel is forming with resistance at $2,220. Immediate support sits at $2,165, with the key floor at $2,120. A break below $2,120 could push ETH toward $2,080 and then $2,050.
The RSI sits at 58, leaning bullish, while the Stochastic Oscillator above 80 suggests possible consolidation before any further push higher.
ETH is currently trading at $2,214, facing short-term resistance at $2,210–$2,220.


