


TLDR
- Analyst Ali Martinez identifies a 9-year ascending triangle on XRP’s monthly chart, targeting $8.50
- Key support zone sits at $0.75–$0.80, flagged as a major “buy the dip” area
- Binance Taker Buy/Sell ratio hit record highs, suggesting growing accumulation
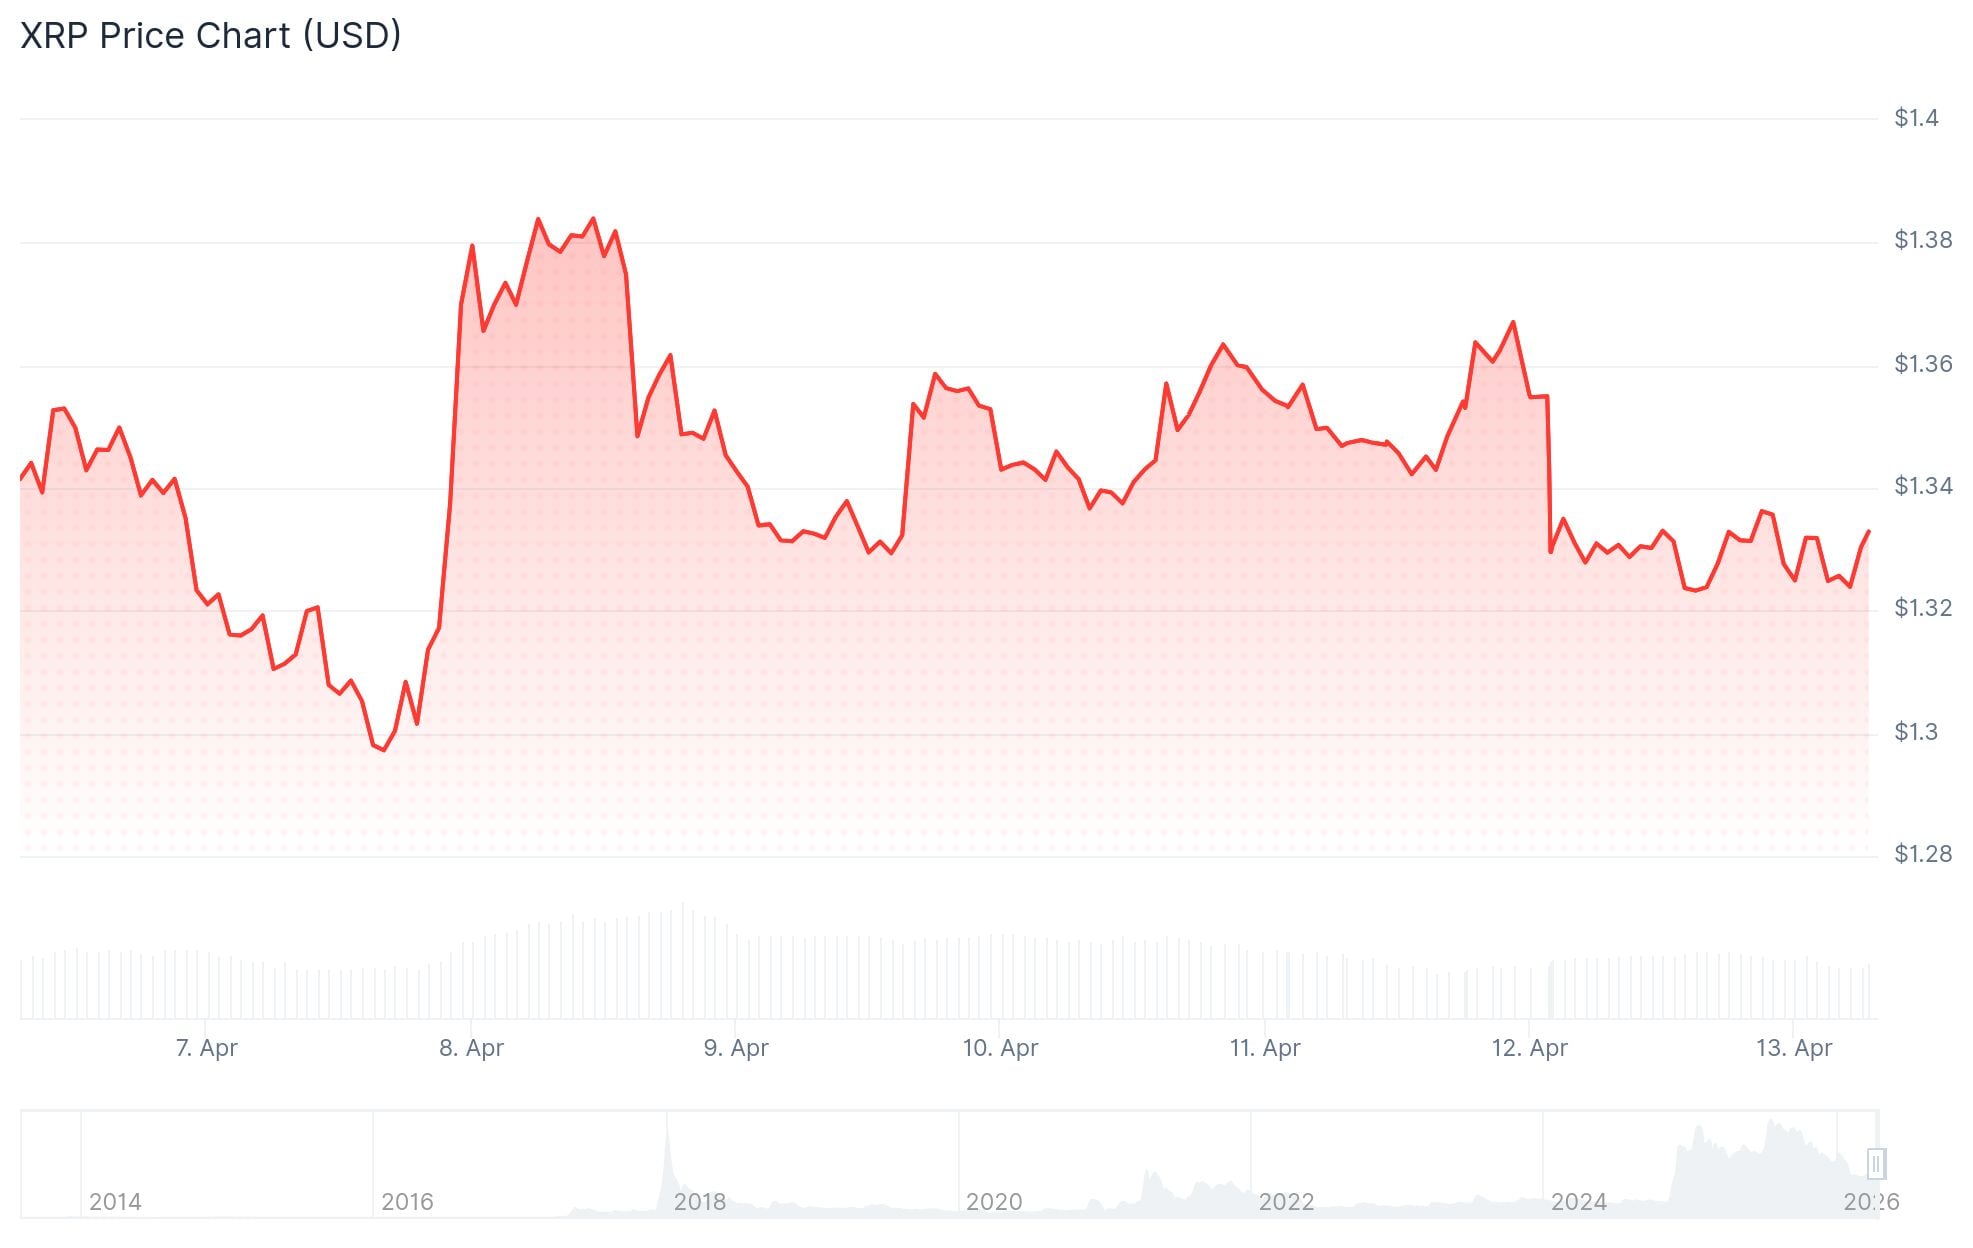
- XRP is currently trading around $1.33, down 1.7% in 24 hours but up 2.36% on the week
- Open interest dropped 1.76% to $2.43 billion, with $3.98M in liquidations — mostly longs
XRP is trading around $1.33 as analysts watch a long-term chart pattern that has been building for nearly nine years. Price action has stayed compressed in a narrow range, with no strong directional move yet confirmed.
Crypto analyst Ali Martinez posted on X that XRP has been forming a large ascending triangle since 2017. Each time XRP has hit the upper resistance, it has been rejected and pulled back to a rising support line. That pattern has repeated multiple times.
The next $XRP bull market will be huge!
XRP is currently trading inside a giant 9-year ascending triangle on the monthly chart. Since 2017, the script has remained the same: XRP hits the upper resistance (X-axis), gets rejected, and retraces to find its floor at the rising… pic.twitter.com/bMJ7q582Id
— Ali Charts (@alicharts) April 12, 2026
Martinez’s chart shows horizontal resistance near $3.30, where previous rallies have stalled. The support line has continued to rise over the years, and the two lines are now approaching their apex — the point where a breakout typically occurs.
His price target, if a breakout happens, is $8.50. That would represent a move of roughly 530% from current levels.
Key Support Zone at $0.75–$0.80
The most recent rejection from resistance came in August 2025. After that move, Martinez pointed to the $0.75–$0.80 range as the area to watch. He described it as the “ultimate buy the dip opportunity” before the triangle reaches its final point.
Analyst Crypto TXG separately noted that XRP is still inside a shorter-term consolidation range between $1.61 and $1.82. No strong directional candles have printed yet, and a breakout from this range is needed before the near-term trend changes.

On-Chain Data Shows Buying Pressure Rising
Analyst CryptoOnchain flagged changes in Binance’s Taker Buy/Sell ratio. The 100-day moving average recently hit a record high. The 30-day figure reached 0.495 for buyers, while the sell ratio fell to 0.505.
That shift means more traders are placing aggressive buy orders, while fewer are selling. It points to quiet accumulation building in the background.
U.S.-based spot XRP ETFs saw $11.5 million in net inflows last week, though some days showed no activity.
🧐 Looking for an encouraging low-risk entry point for XRP? According to our weekly social data for crypto's #4 market cap, FUD is at its 3rd highest point in the past 2 years.
📉 Historically, when bullish comments get replaced by this level of bearish ones, the probability of… pic.twitter.com/JfAa2btWed
— Santiment (@santimentfeed) April 13, 2026
Santiment noted that social media FUD around XRP is at its third-highest level in two years. The data firm pointed out that historically, when bearish sentiment peaks like this, prices have often moved in the opposite direction.
Open interest fell 1.76% to $2.43 billion. Liquidation data showed $3.98 million wiped in 24 hours, with $3.35 million coming from long positions — a sign of continued short-term pressure on bullish traders.


