


 Price: BTC Taps $76K — Here’s What’s Holding It Back")


TLDR
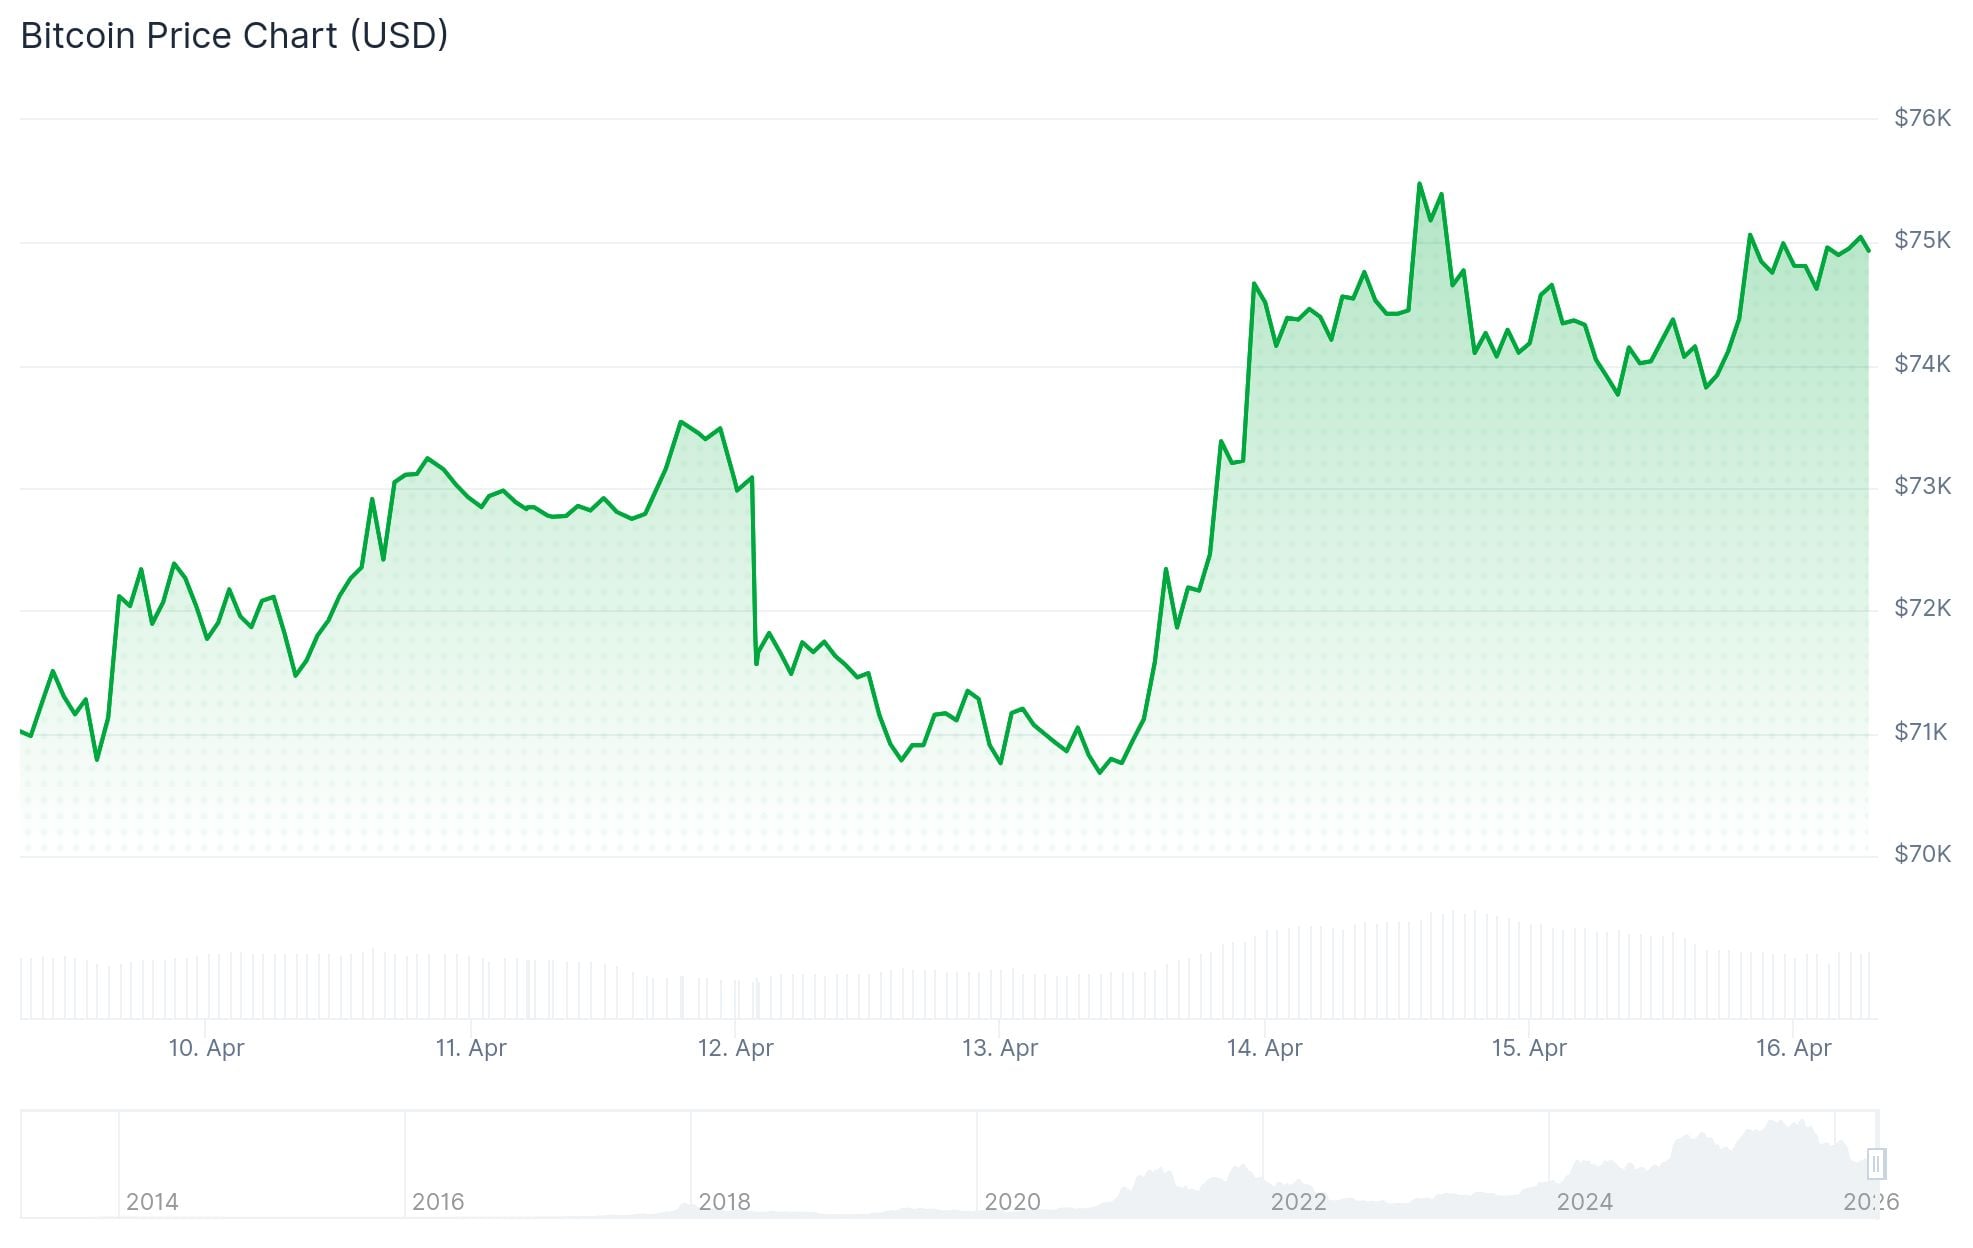
- Bitcoin has climbed nearly 10% this month but is stalling near $75,000
- On-chain data shows investors are selling into strength, with $1.14 billion in realized profits on Tuesday
- Funding rates are slightly negative, suggesting traders remain cautious
- Spot demand is uneven, with buying concentrated mostly on Binance
- U.S. spot Bitcoin ETFs recorded $186 million in net inflows on April 15
Bitcoin’s rally this month has been strong, rising nearly 10% to tap $75,000. But the move is slowing down, and on-chain data helps explain why.
The realized profit/loss ratio, tracked by Glassnode, shows investors are selling into price strength. The 30-day EMA of this indicator sits at 1.16, above the 1.0 threshold that signals net profit-taking. On Tuesday, as BTC briefly touched $76,000, investors locked in around $1.14 billion in profits — one of the largest single-day readings this year.
Vikram Subburaj, CEO of Indian exchange Giottus, said the market is consolidating rather than overheating. “Funding rates remain slightly negative, showing that traders are still cautious and not yet leaning aggressively long,” he said.
Uneven Demand Across Exchanges
Buying pressure is not spread evenly. According to Glassnode, aggressive buyers have been active mainly on Binance, while Coinbase and other exchanges show weaker demand. This uneven cumulative volume delta points to a market absorbing supply, not overwhelming it.
Options traders on Deribit are also showing a bias toward put options across all timeframes, reflecting lingering caution and demand for downside protection.
Macro Backdrop and ETF Flows
The Bitcoin move is happening alongside strong U.S. equity performance. The Nasdaq hit a new all-time high of 24,016 on Wednesday, and the S&P 500 reached 7,022. Tech stocks led gains, up 2.08% on the day.
Positive sentiment around a possible de-escalation of the U.S.-Iran conflict added to the mood. President Trump said on Wednesday he views the situation as “very close to being over,” though he noted a deal still needs to be reached.
$BTC has broken out of its 7-month downtrend.
Weekly MACD bullish cross has happened too.
This could give one final push to Bitcoin towards the $77,000-$78,000 level.
After that, BTC will drop to new lows in Q2 2026.
IMO, the new Fed chair will accelerate rate cuts and… https://t.co/PJNXsvSRJZ pic.twitter.com/cYGW63A3ey
— Ted (@TedPillows) April 15, 2026

Analyst Ted Pillows (@TedPillows) noted on X that BTC has broken out of its 7-month downtrend and that a weekly MACD bullish cross has occurred. He sees a possible push toward $77,000–$78,000 before a pullback in Q2 2026.
On April 15 (ET), U.S. spot Bitcoin ETFs recorded total net inflows of $186 million, with BlackRock’s IBIT posting the largest single-day net inflow at $292 million. Spot Ethereum ETFs saw total net inflows of $67.85 million. SOL spot ETFs recorded total net inflows of $5.36… pic.twitter.com/J1uUzjiHAj
— Wu Blockchain (@WuBlockchain) April 16, 2026
On-chain analyst Wu Blockchain reported that U.S. spot Bitcoin ETFs saw $186 million in net inflows on April 15. BlackRock’s IBIT led with $292 million in single-day inflows. Spot Ethereum ETFs added $67.85 million, while XRP spot ETFs pulled in $17.11 million.
Glassnode noted that a sustained move above $78,100 would require the market to absorb the current overhead supply from profit-takers.


