


 Price: Rally to $3,000 in Sight as Accumulation Wallets Hit Record Highs")


TLDR
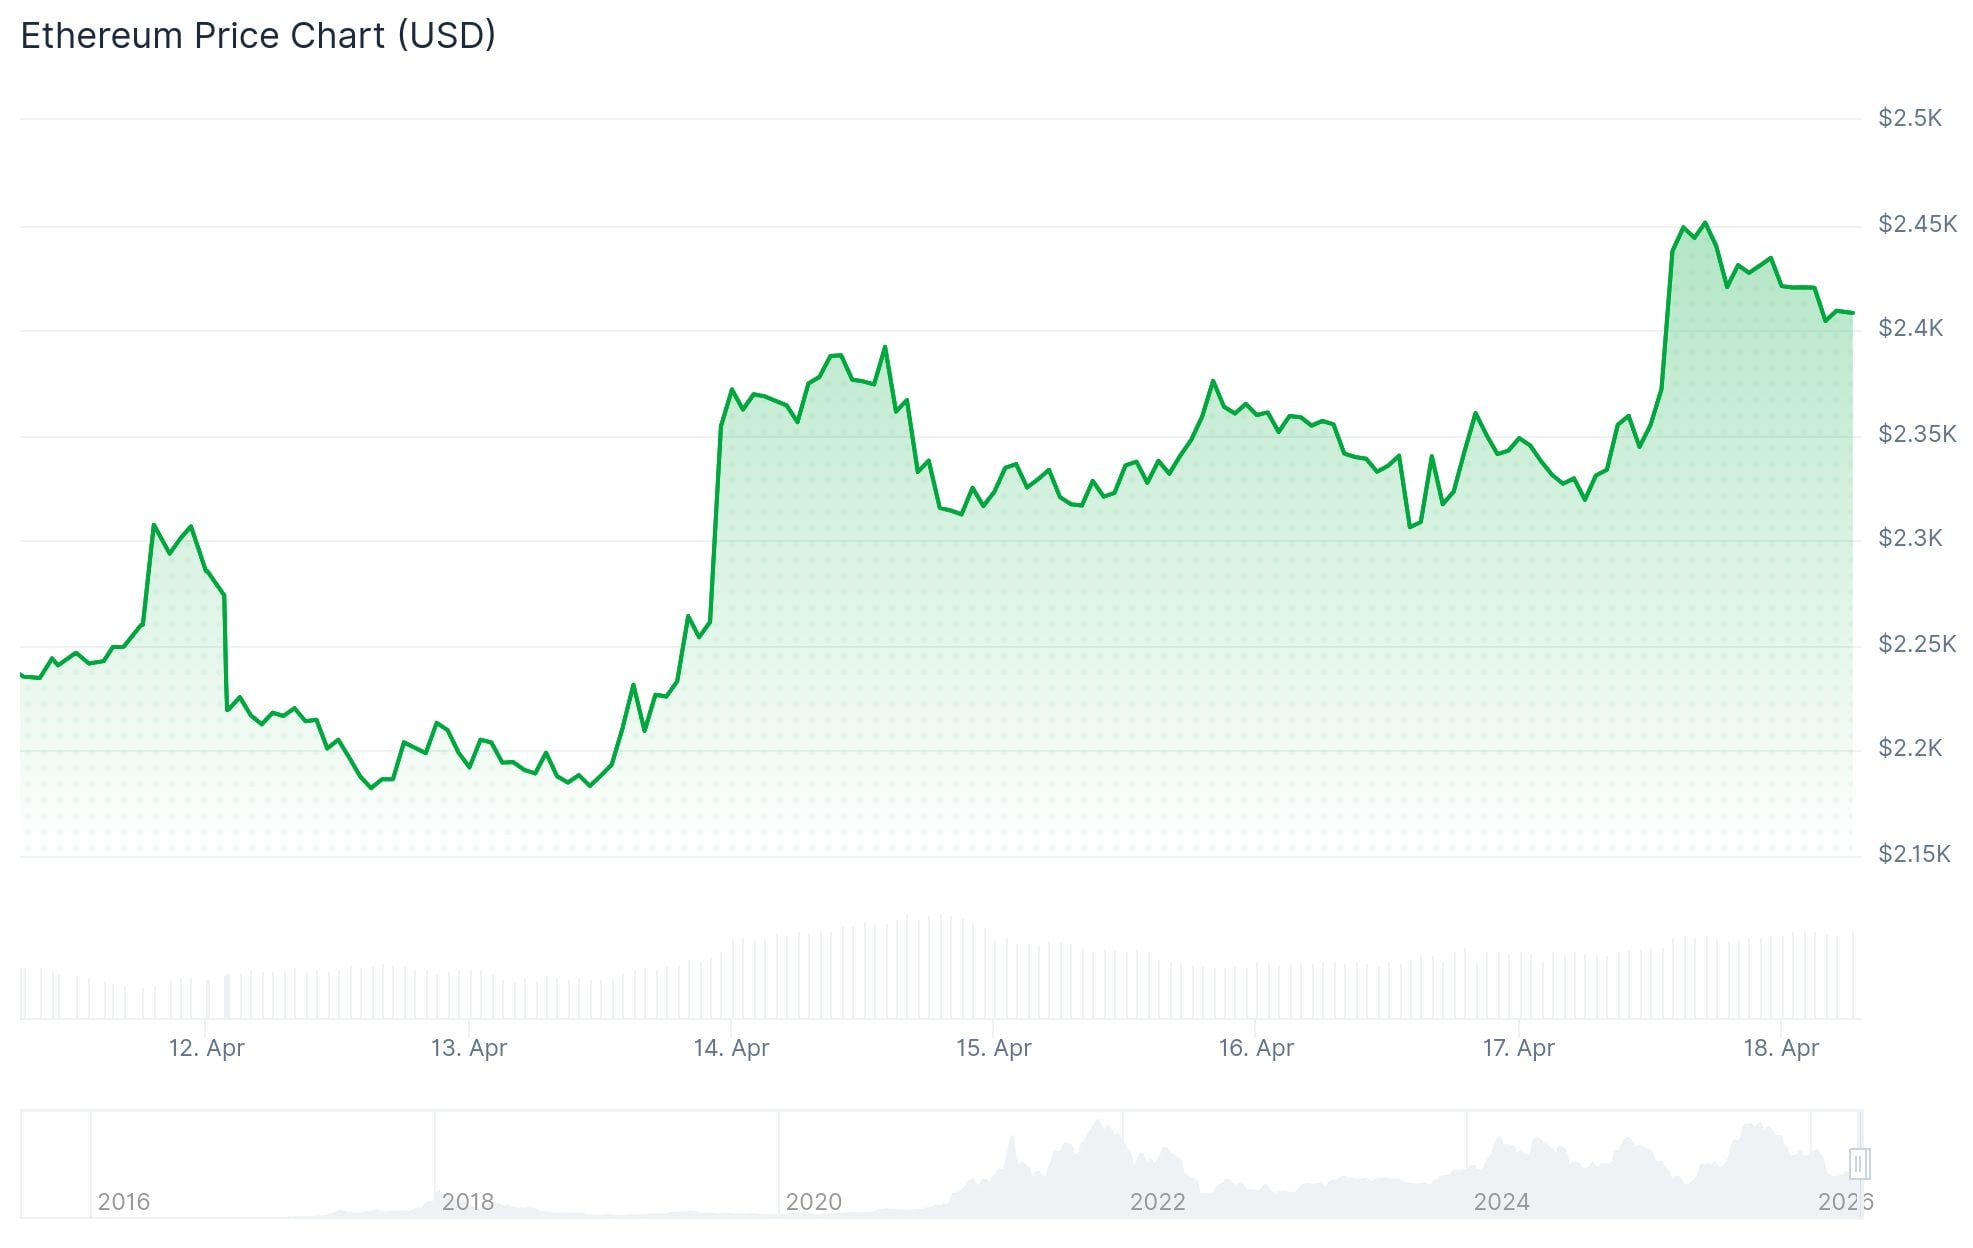
- ETH has climbed above $2,400, roughly 38% above its swing low of $1,750
- Accumulation wallet balances rose 33%, adding 6.5 million ETH since January 1
- A cup-and-handle chart pattern targets a price of $2,960–$3,150
- Spot ETH ETFs posted seven consecutive days of net inflows totaling $298.4 million
- Iran’s reopening of the Strait of Hormuz eased geopolitical pressure, boosting ETH’s price
Ethereum has pushed above $2,400, continuing a recovery that started from a swing low of $1,750. The move puts ETH roughly 38% above that bottom. Several on-chain and technical data points are now drawing attention from traders and analysts.
ETH’s daily active addresses jumped 89%, rising from 384,763 to 730,278 on April 5. This kind of activity has appeared near market bottoms before, including in 2022, ahead of price recoveries.
Daily inflows into accumulation addresses hit an all-time high of 1.14 million ETH in November 2025. In 2026, those inflows have averaged 200,000 ETH per day, with a spike to 358,000 ETH on Thursday.

The total ETH balance in accumulation wallets — addresses with no history of selling — has grown from 19.64 million to 26.16 million ETH since January 1. That is a 33% increase.
Staked ETH now stands at 39.2 million ETH. ETH supply on exchanges has also dropped to multi-year lows, reducing available liquidity on order books.
Cup-and-Handle Pattern Points to $3,150
On the charts, ETH has broken out of a cup-and-handle pattern on the 12-hour timeframe. A confirmed close above the $2,400 neckline sets a measured target of around $2,960. The 14-day RSI is at 65–68, placing it in bullish territory.
Trader TheSkayeth identified a larger cup-and-handle pattern forming over two months on the daily chart. The analyst said ETH was “setting up for a massive move” and that if the pattern plays out, the target reaches the “golden zone.” The measured target from that larger formation is $3,150.

Everyone is crying about how $ETH and $BTC did not do very well compared to other altcoins today.
But that's because they are setting up for a MASSIVE move.
If the cup and handle pattern continues, I think we get to the golden zone next.
Save this.
Don't miss out. pic.twitter.com/TP2NllZCs7— Sky (@TheSkayeth) April 17, 2026
ETF Inflows Signal Returning Institutional Interest
Spot ETH ETFs have posted seven straight days of net inflows, totaling $298.4 million, according to SoSoValue data. On April 17 alone, spot Ethereum ETFs saw $127 million in net inflows, per Wu Blockchain.
On April 17 (ET), U.S. spot Bitcoin ETFs recorded total net inflows of $664 million, extending the inflow streak to four days. Spot Ethereum ETFs posted total net inflows of $127 million, marking seven consecutive days of inflows. pic.twitter.com/bJlzcFT23L
— Wu Blockchain (@WuBlockchain) April 18, 2026
Ethereum’s price also got a lift from easing geopolitical tensions. Iran announced the reopening of the Strait of Hormuz following ceasefire developments involving the US and Lebanon. ETH is now trading above its on-chain average cost basis of $2,308.
The MACD on ETH’s weekly chart has posted a golden cross — a signal that previously marked price bottoms in November 2024 and May 2025.
Open interest in Ethereum derivatives has climbed to 14.67 million ETH. Funding rates have turned negative, showing that short traders are opening positions expecting a pause. Over the past 24 hours, $163.2 million in ETH liquidations occurred, with $140.9 million coming from short positions.
ETH’s immediate support sits at the 100-day EMA near $2,378. Resistance above is at $2,746, with a stronger level at $3,411.


