


TLDR
- XRP is hovering around $1.40, a key support level, with bearish momentum building on the 4-hour chart
- A descending triangle pattern has formed, with MACD crossing below the signal line
- RSI has dropped to 40, pointing to weakening buying pressure
- XRP ETFs saw $15.74M–$25M in inflows last week, showing continued institutional interest
- Analyst Ali Charts posted that XRP is “ready for a big price move,” with cycle bottom possibly at $1.30
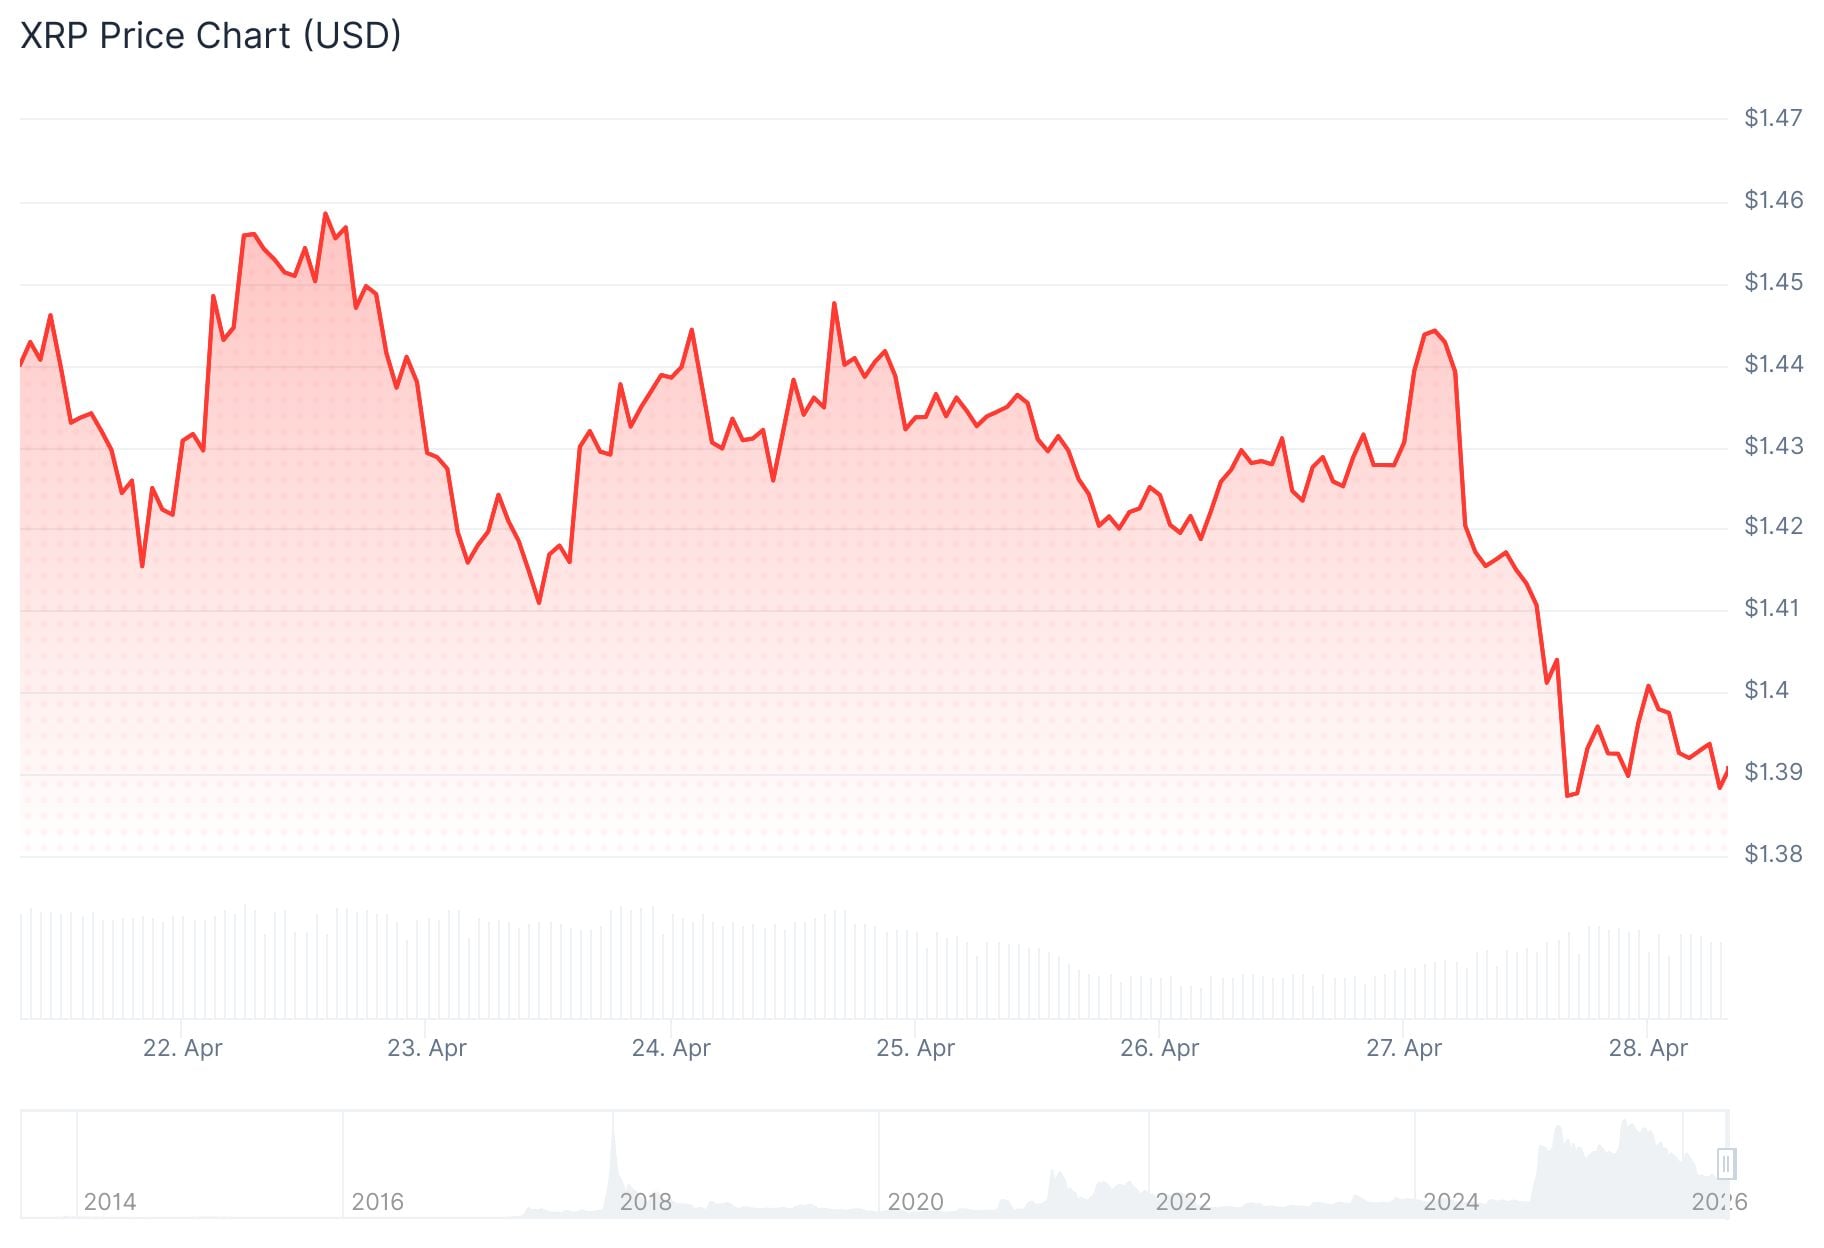
XRP is trading near $1.40 after failing to hold gains made earlier in the week. The token has been under pressure as sellers regained control and momentum indicators turned negative.
The 4-hour chart shows a descending triangle forming. This pattern is made up of lower highs pressing down on a flat support line. It often points to more downside if the support breaks.
Ripple is currently consolidating inside a symmetrical triangle pattern on the daily chart
If confirmed, we might see $XRP surge toward $3.30🎯👇Crypto Traders-join Telegram👇 https://t.co/oRAVD0i3ly
. pic.twitter.com/dGVJrUsC10— Whales_Crypto_Trading 🐋 (@WHALES_CRYPTOt) April 27, 2026
The MACD has crossed below the signal line. Red histogram bars are growing, which shows downside momentum is picking up. The RSI has fallen to around 40, meaning buyers are losing strength.
The $1.40 level has been tested multiple times in recent sessions. Repeated tests of support tend to weaken it over time, raising the chance of a breakdown.
If XRP drops below $1.40, the next support levels are at $1.38, then $1.36, and possibly $1.34 if selling pressure continues.
Key Resistance Levels to Watch
On the upside, bulls need to reclaim $1.43 first. A stronger barrier sits at $1.45, which lines up with the descending trendline. A break above $1.45 could open the path to $1.50.

In the past 30 days, Bitcoin and Ethereum have gained 17% and 16% respectively. XRP has returned just 5% in the same period, showing that investors are still favoring higher-quality assets.
Analyst Ali Charts posted on X that “$XRP is ready for a big price move,” though no specific price target was given in the post.
$XRP is ready for a big price move! pic.twitter.com/6MKyu4vbeh
— Ali Charts (@alicharts) April 27, 2026
One analyst noted that XRP’s weekly RSI dropped to 30 in early March. Historically, the three previous times the RSI fell below 33, XRP saw gains of between 226% and 1,460% in the months that followed.
Based on that pattern, analysts at FX Empire believe the cycle bottom may have already been set at $1.30. They see a potential move to $1.50 as the short-term target, followed by $1.65.
XRP ETF Inflows Stay Positive
XRP-linked ETF products brought in between $15.74 million and $25 million last week, depending on the data source. Year-to-date inflows for XRP ETFs now stand at $148 million.
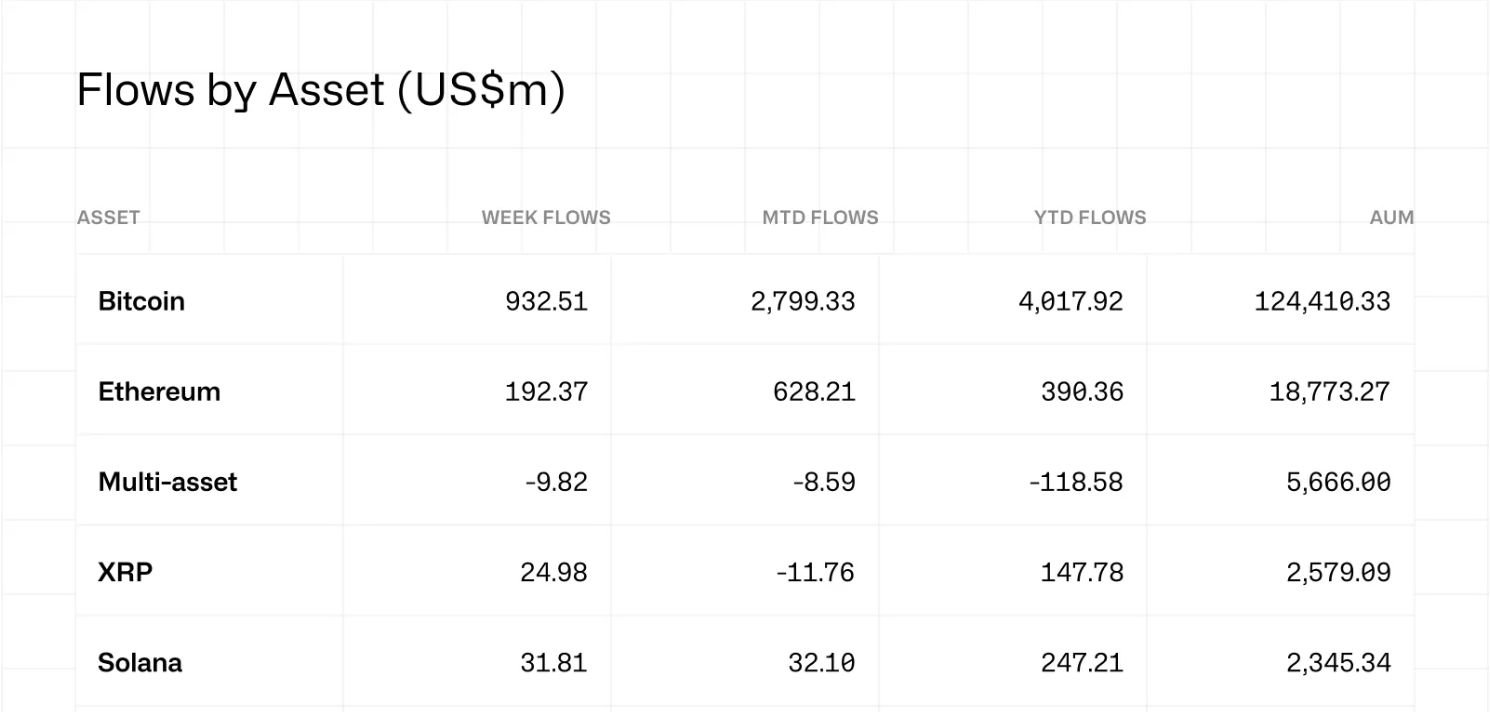
Bitcoin ETFs led all crypto funds with $824 million in weekly inflows, marking four straight weeks of positive flows. Ethereum ETFs added $155 million, while Solana funds brought in $9.44 million.
The broader crypto ETP market saw $1.2 billion in inflows last week, according to CoinShares. The Crypto Fear and Greed Index currently sits at 44, down from a recent high of 62.
The FOMC meeting on April 28 is being watched closely. Markets expect no rate change, and analysts say no rate cuts are expected for the rest of the year.


