


 Price: ETH Enters Its Wildest Month — Here’s What the Data Says")


TLDR
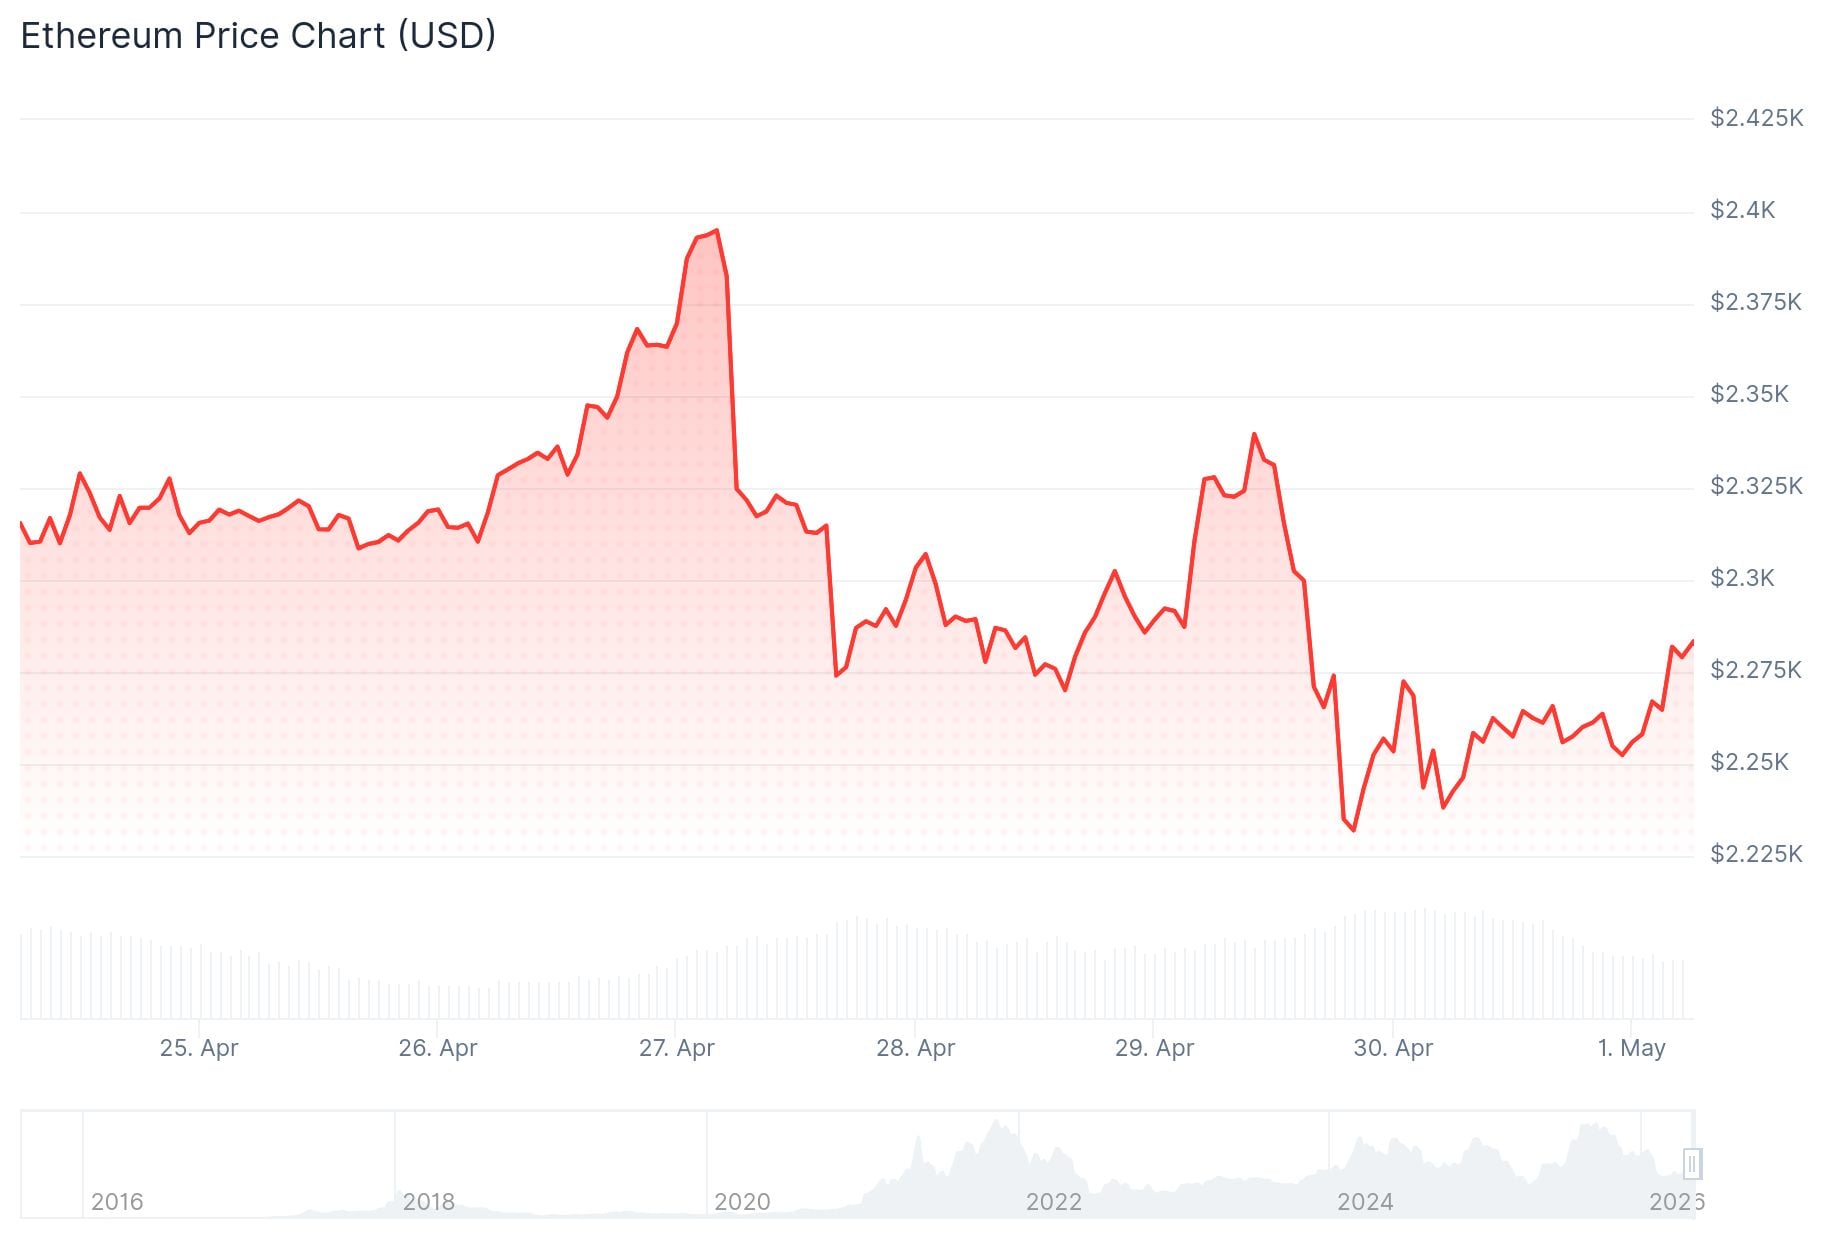
- ETH is trading around $2,260, weighed down by rising US inflation and global macro uncertainty.
- Futures market data shows negative taker buy-sell ratios and negative funding rates, pointing to bearish short-term sentiment.
- Analyst Ted Pillows warns that a drop below $2,150–$2,200 could trigger a sharp sell-off.
- On Binance, derivatives data shows a shift toward bullish positioning, with the taker buy-sell ratio above 1.
- May has historically been one of Ethereum’s most volatile months, with wide swings in both directions.
Ethereum is trading around $2,260 as macro headwinds and mixed derivatives data shape the short-term price outlook heading into May.
The US Personal Consumption Expenditures (PCE) Price Index rose 3.5% year-on-year in March, up from 2.8%. The Federal Reserve’s preferred inflation measure, core PCE, climbed to 3.2% — its highest level since November 2023. Higher inflation makes interest rate cuts less likely, which typically reduces risk appetite in crypto markets.
Geopolitical tension in the Middle East is adding to the cautious mood across financial markets.
In the Ethereum futures market, the taker buy-sell ratio has moved into negative territory. This metric tracks the difference between buyers and sellers using market orders on perpetual contracts. Its 14-day moving average has been falling since mid-April.

ETH funding rates have also been negative during this period. Negative funding rates suggest that bearish traders are paying a premium, pointing to short-term pessimism in the market.
Open interest has settled around 13.5 million ETH, down from 14.4 million ETH on April 18. This suggests traders are pulling back rather than building new positions.
Key Price Levels to Watch
On the price chart, ETH is trading below its 20-day EMA at $2,287 and its 100-day EMA near $2,365. The Relative Strength Index (RSI) is hovering near the neutral 50 mark, while the Stochastic Oscillator is in oversold territory.

Ethereum’s realized price — the average on-chain cost basis — sits at $2,308, which has acted as resistance. Prices have failed to break above this level, suggesting holders are selling when they break even.
Support sits at $2,211, with the 50-day EMA near $2,244. Below that, the next levels are $2,108, $1,909, and $1,741.
Crypto analyst Ted Pillows flagged the $2,150–$2,200 zone as a critical area, stating that if ETH drops below it, “the dump will accelerate.” He sees the zone as a potential base for another bounce.
$ETH almost tapped the $2,200 support zone yesterday.
This zone should hold for another bounceback.
If Ethereum drops below the $2,150-$2,200 level, the dump will accelerate. pic.twitter.com/1v7jFrH6tJ
— Ted (@TedPillows) April 30, 2026
ETH saw $38.2 million in liquidations in the past 24 hours, with $19.5 million coming from short positions.
Binance Data Points to Bullish Shift
On Binance specifically, the taker buy-sell ratio is above 1, according to CryptoQuant data cited by analyst Rei Researcher. This is in contrast to the broader market picture. It suggests that on Binance, buyers are currently more aggressive than sellers.
Open interest has ticked up slightly from recent lows, pointing to gradual long positioning. However, leverage growth remains limited overall, which reduces the chance of a sudden large liquidation event.
May Volatility Pattern
Historical data from CoinGlass shows that May is one of Ethereum’s most unpredictable months. Both average and median returns for May sit at the extremes compared to other months — higher highs and lower lows.
$ETH In terms of historical data, May is an absolute outlier in terms of ETH's average returns. Both in terms of averages and median.
One thing that's clear for the month of May is that it usually sees a lot of volatility either way. pic.twitter.com/fF1o6ZNpVZ
— Daan Crypto Trades (@DaanCrypto) April 30, 2026
Analyst Daan Crypto Trades noted this pattern, pointing out that May tends to produce outsized moves rather than steady trends.
ETH entered May 2026 trading near $2,261.


