


 Price: Bears Reject $90 Six Times — Is a Drop to $50 Next for SOL?")


TLDR
- SOL is down 33% year-to-date, making it the worst performer in the top 5 cryptos
- Network usage has dropped for nine consecutive weeks, now 32% below its recent peak
- Bears have rejected a move above $90 six times; price is stuck between $77–$90
- The weekly RSI crossed above its signal line in mid-April, mirroring a pattern seen before a 2,400% rally in 2022
- If history repeats, SOL could fall to the low $50s before its next major move higher
Solana (SOL) is trading around $84 after finding support at $81.40 and staging a modest recovery. The price climbed back above $83.50 and broke above a bearish trend line that had been holding resistance at $83.45 on the hourly chart.
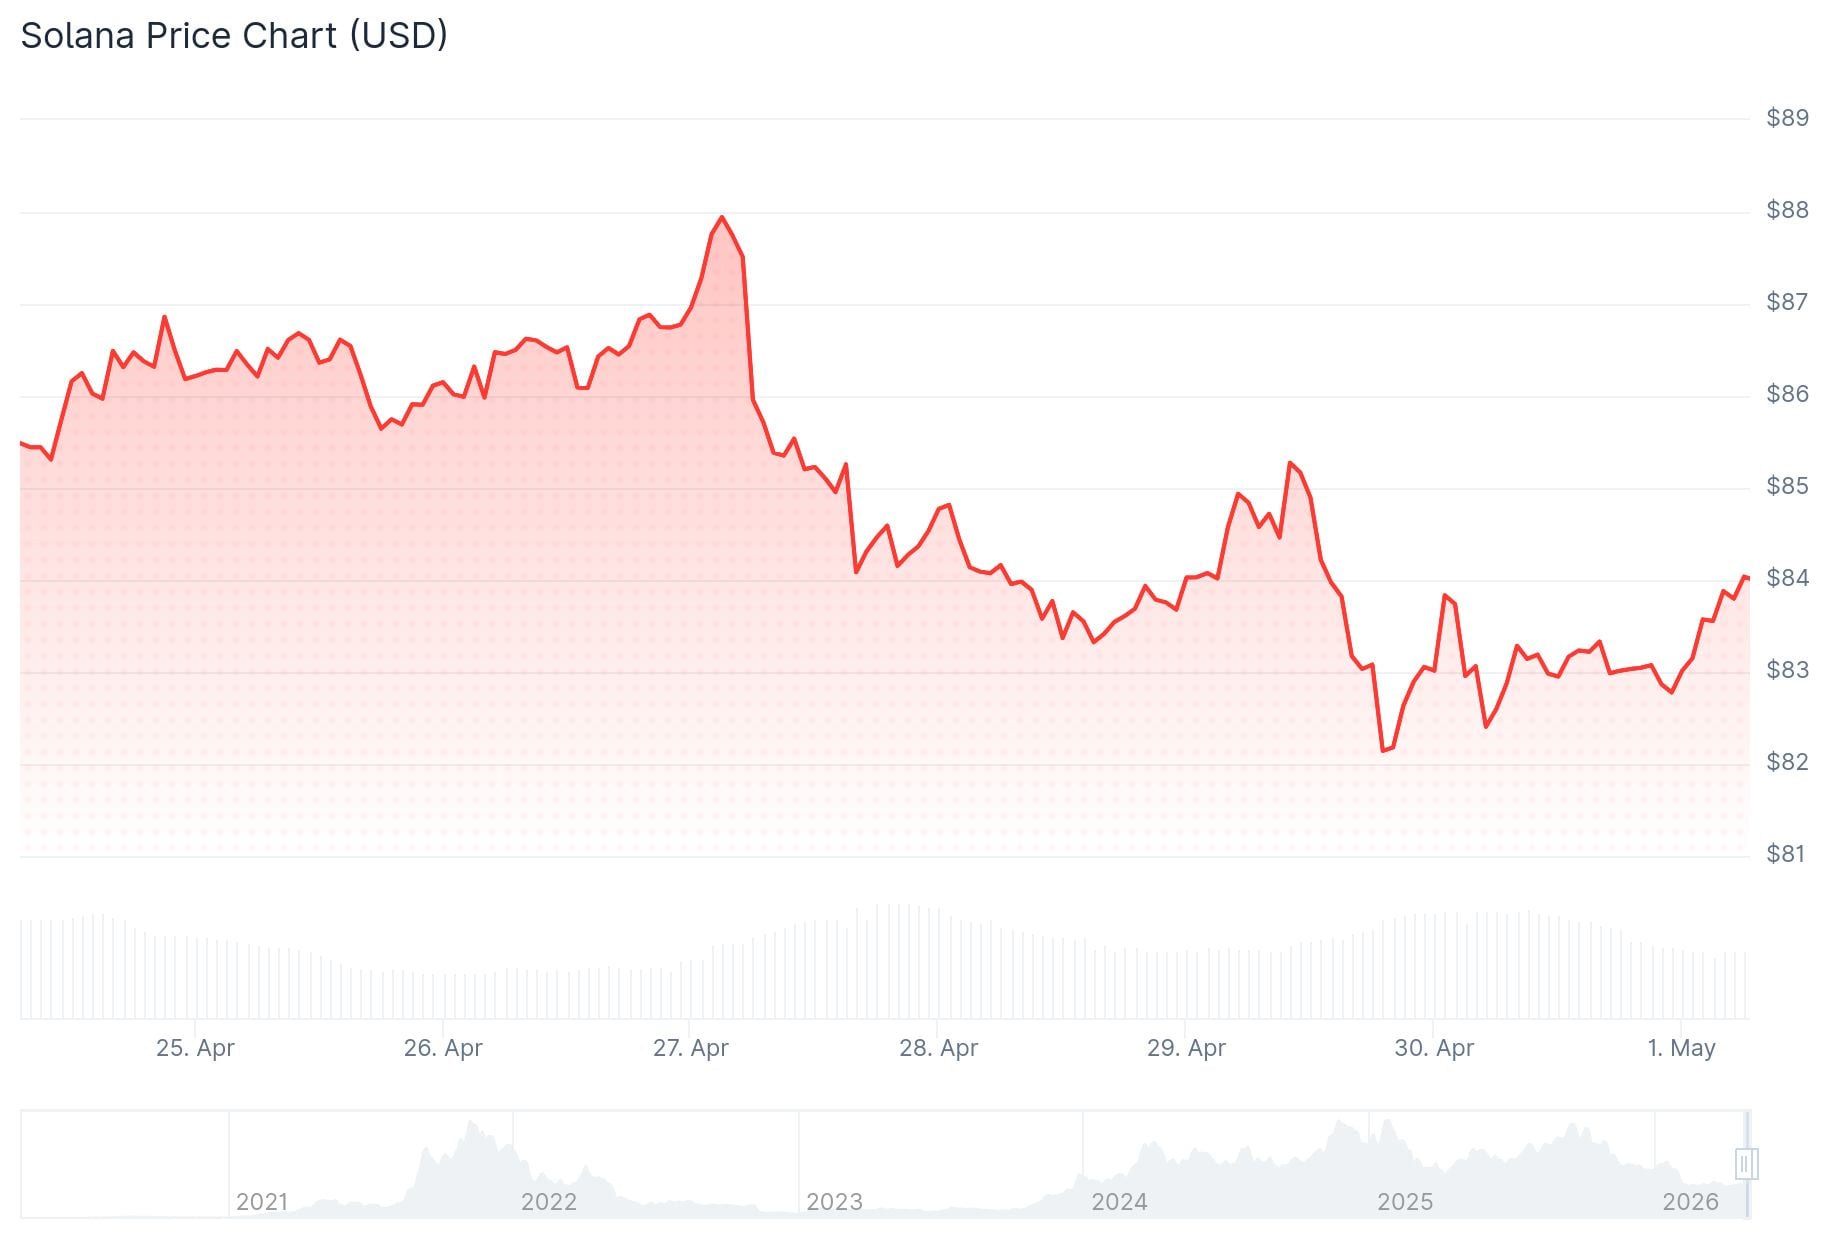
The recovery came alongside similar moves in Bitcoin and Ethereum. SOL moved above the 50% Fibonacci retracement level of its recent drop from $85.48 to $81.40.
Despite the bounce, bears remain active below $85. Immediate resistance sits at $84.50, with the next major level at $85.50. A break above $87 would be needed to open the door toward $92 and eventually $102.
If SOL fails to clear $85.50, the next supports to watch are $83.45, then $82.50, and below that, $81.40. A close under $81.40 could push the price down to the $77 zone.
Network Activity Continues to Slide
On-chain data tells a weaker story. Solana’s transaction volume has declined for nine consecutive weeks. It now sits 32% below the peak of 959 million transactions seen during the week ending February 8.
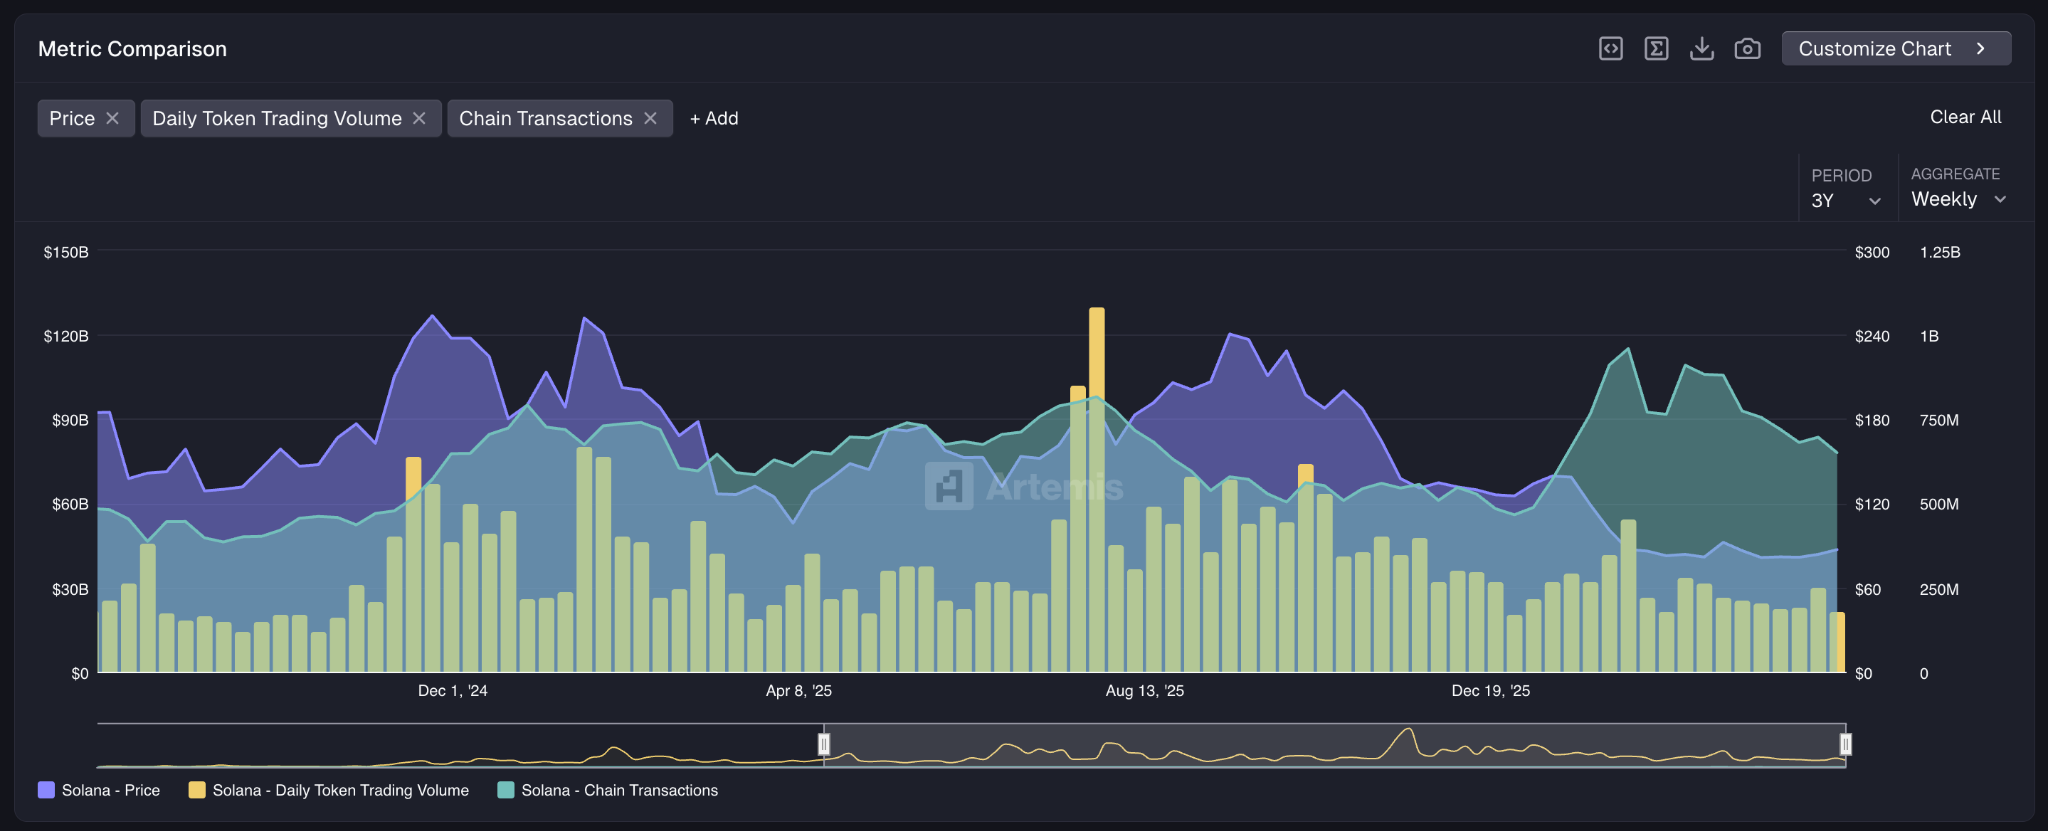
Trading volumes are also thin. Last week saw $22 billion in SOL trades — about half of what was seen during the April–September 2025 bull market, and just 20% of peak levels.
Solana underperformed during April’s market rally. Bitcoin gained 14% and Ethereum gained 10%, while SOL managed only a 2.8% move.

Year-to-date, SOL is down 33%, making it the worst performer among the top five cryptocurrencies.
Macro Conditions Add Pressure
The broader macro environment is weighing on altcoins. The PCE Price Index rose from 2.8% in February to 3.5% in March, signaling higher inflation driven largely by energy costs. Oil prices are back above $100 as the U.S. blockade of the Strait of Hormuz continues.
The Federal Reserve held rates steady at its latest meeting, with no cuts expected this year. Jerome Powell delivered his final speech as Fed Chair, and the FOMC showed internal disagreement over its tone on future policy.
Investors are avoiding riskier assets. Capital is staying in Bitcoin and Ethereum, with little appetite for altcoins like SOL.
RSI Pattern and a Possible Drop to $50
The weekly RSI for SOL hit 30 back in February and crossed above its 14-week moving average in mid-April. A near-identical pattern occurred in November 2022 — but before the rally began, SOL dropped from $13 to $9 first.
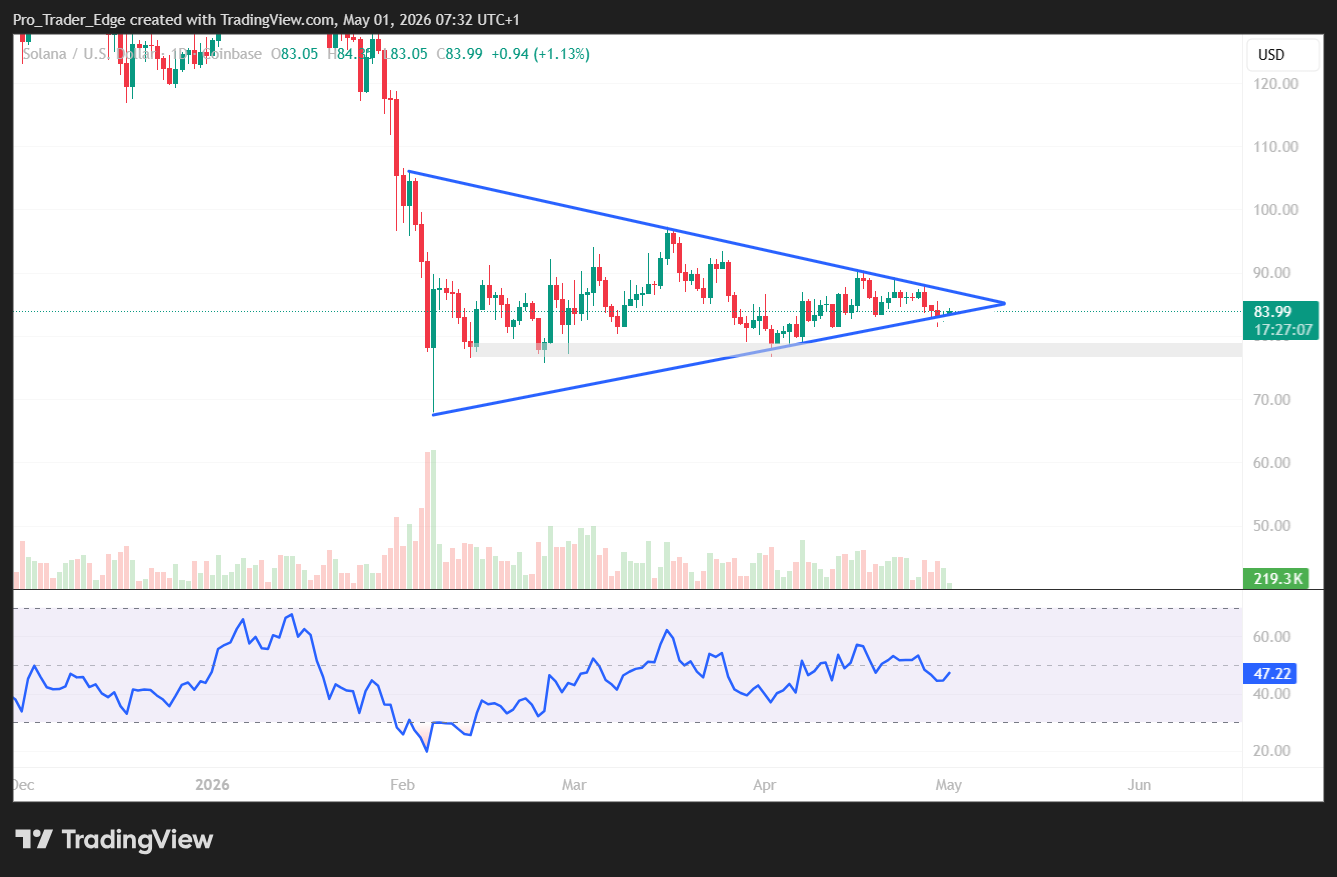
If that pattern plays out again, SOL could fall to the low $50s before its next major upward move.
SOL has been trading between $77 and $90 for two months. Bulls attempted a break above $90 but were turned back by heavy selling. The price remains in consolidation.


