


TLDR
- XRP is repeating a 2025 chart pattern that previously triggered 66% gains to $3.66
- The bull flag breakout above $1.40 is the key level analysts are watching
- A symmetrical triangle on the daily chart points to a possible move toward $1.90, then $2
- Spot taker CVD flipped positive on May 1, showing buyers are back in control
- Open interest delta hit +$27 million on May 1, reflecting fresh derivatives positioning
XRP is trading near $1.39–$1.41 as of early May 2026, consolidating after testing short-term highs. The price action is drawing attention from analysts who see similarities to a chart structure that played out in mid-2025.
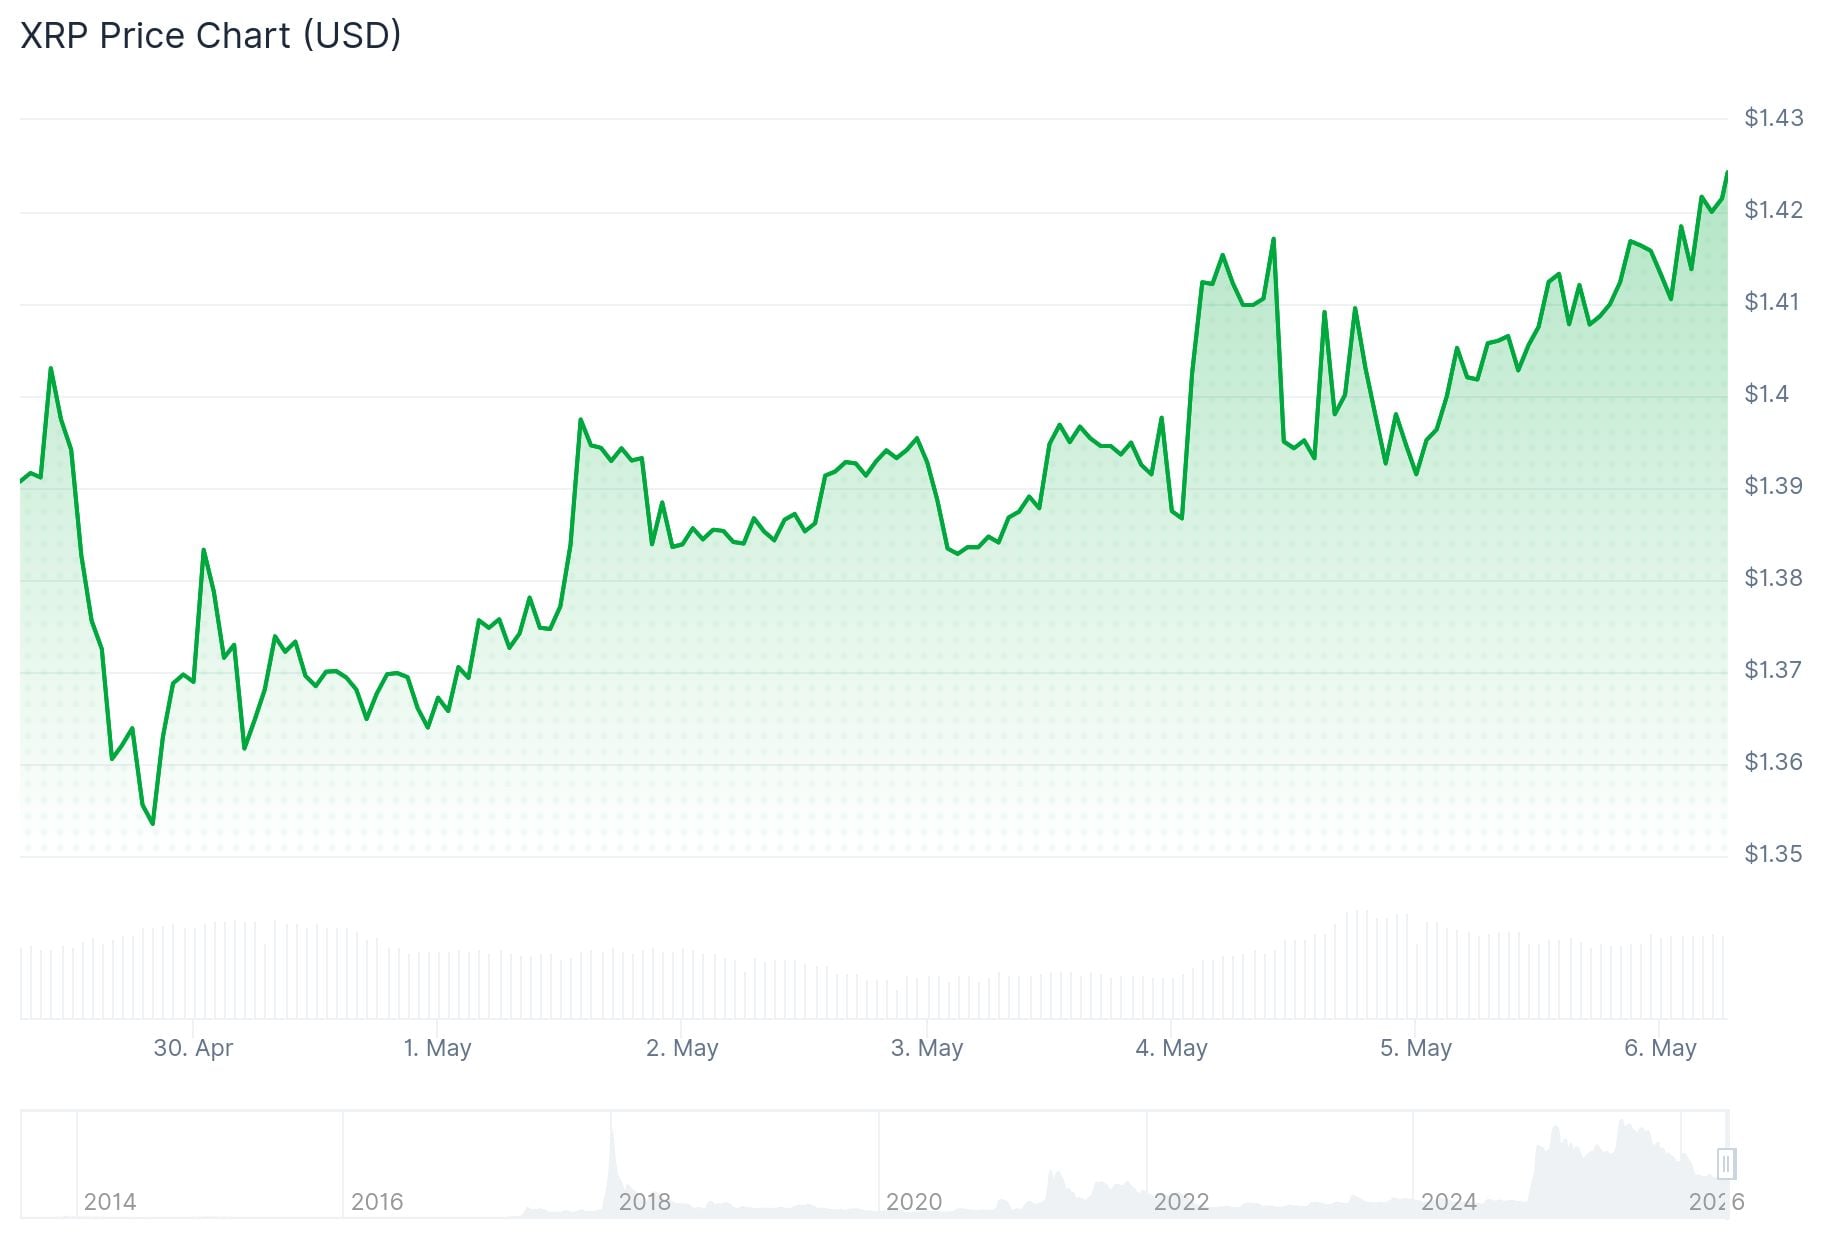
That 2025 pattern — a bull flag followed by a bullish EMA crossover — led to a 66% rally in under two weeks, pushing XRP from around $2.21 to its current all-time high of $3.66.
Today’s setup is following the same script. XRP has broken out of a similar bull flag, and the 20-day and 50-day EMAs are nearing a bullish crossover.
Analyst Jack Straw noted on Tuesday that XRP is “gaining momentum above $1.40, holding firmly over its 100-hour SMA,” adding that “a clean break above $1.420 could trigger the next leg up.” Analyst Sam Mti also flagged a buy signal from the MTI indicator, calling the setup “looking good” with potential to reach $1.45 as long as $1.40 holds.
📈XRP is gaining momentum above $1.40, holding firmly over its 100-hour SMA. A bullish trend line is forming at $1.3920, and a clean break above $1.420 could trigger the next leg up. 🚀
Meanwhile, trading #XRPL tokens just got a serious upgrade with DEX Pro — built for speed,… pic.twitter.com/z2O724dkNv
— Jack Straw (@JackStr42679640) May 5, 2026
If the 66% fractal repeats from current levels, a price target of around $2.35 comes into view.
Buyers Return as CVD Flips Green
One of the cleaner data points backing the bullish case is XRP’s 90-day spot taker cumulative volume delta (CVD). This metric measures the difference between buy and sell volume over three months.
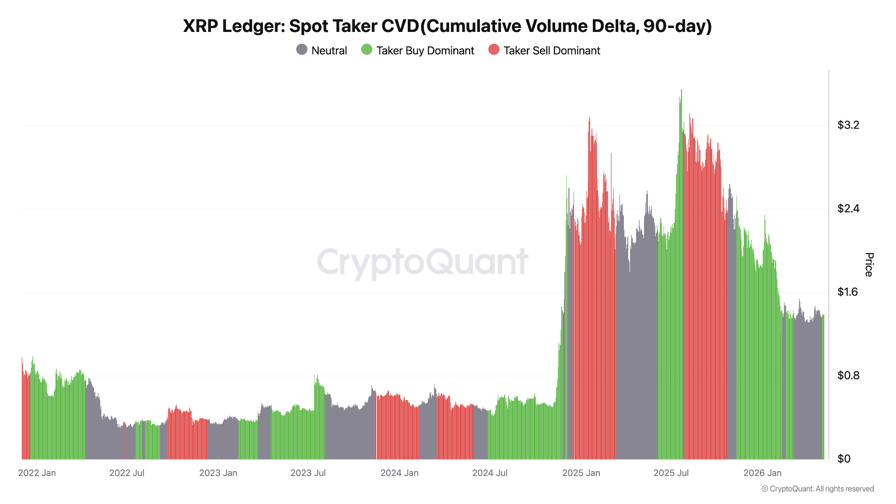
It flipped positive on May 1, the same day XRP broke above the $1.38 resistance level. A similar CVD flip happened in June 2025 and preceded 70% gains.

CryptoQuant analyst Amr Taha highlighted a sharp positive reading in open interest delta, which hit $27 million on May 1. “When this happens while price is rising, it often shows that traders are increasing exposure as momentum begins to recover,” Taha said.
Triangle Pattern Points to $1.90
On the daily chart, a separate symmetrical triangle pattern is also forming. In this structure, two converging trendlines compress price until a breakout occurs.
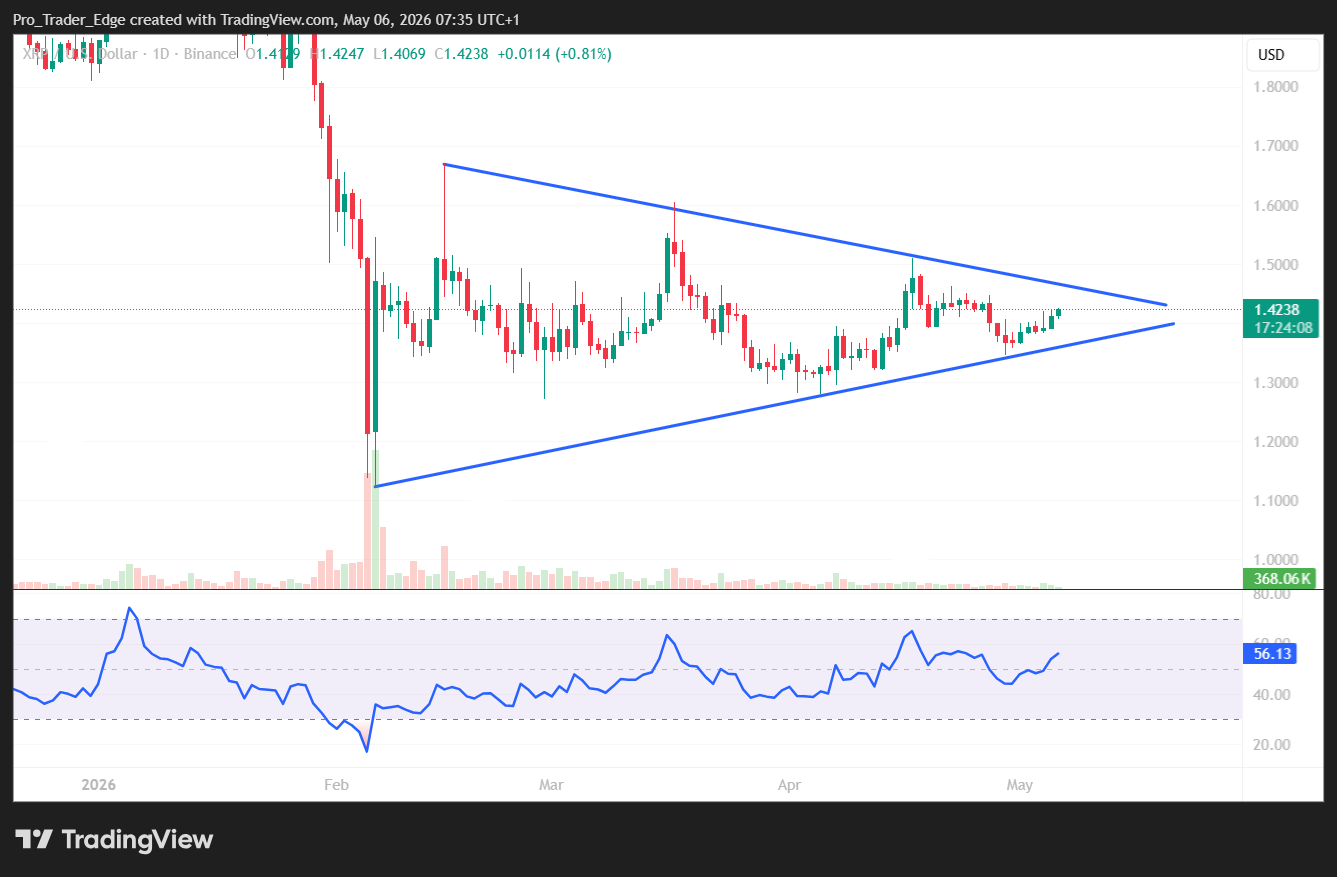
A confirmed move above $1.45 would validate this pattern and project a target near $1.90 — a level derived from the triangle’s height. Beyond that, the $2 level is the next psychological target.
Momentum indicators are lining up too. The Supertrend indicator has flipped green, signaling a trend shift. The MACD is nearing a bullish crossover, which, if confirmed, would add further weight to the upside case.
The price needs to hold above $1.40 — the bull flag’s upper boundary and the 50-day SMA — for the setup to remain valid.


