


 Price: Analysts Are Watching This One Level Very Closely")


TLDR
- DOGE is trading around $0.1102–$0.1105 with a market cap of $18.73 billion
- Price is consolidating and testing the 0.618 Fibonacci resistance level at $0.11799
- Analyst BitGuru sees a potential move toward $0.13–$0.15 if momentum builds
- Derivatives data shows falling open interest and volume, though funding rates stay slightly positive
- Analyst Cryptollica compares the current setup to previous cycle bottoms in 2015, 2020, and 2022
Dogecoin is trading near $0.1105 as of May 17, 2026, with a 24-hour gain of 1.23%. Daily trading volume sits at $1.29 billion and market cap at $18.73 billion.
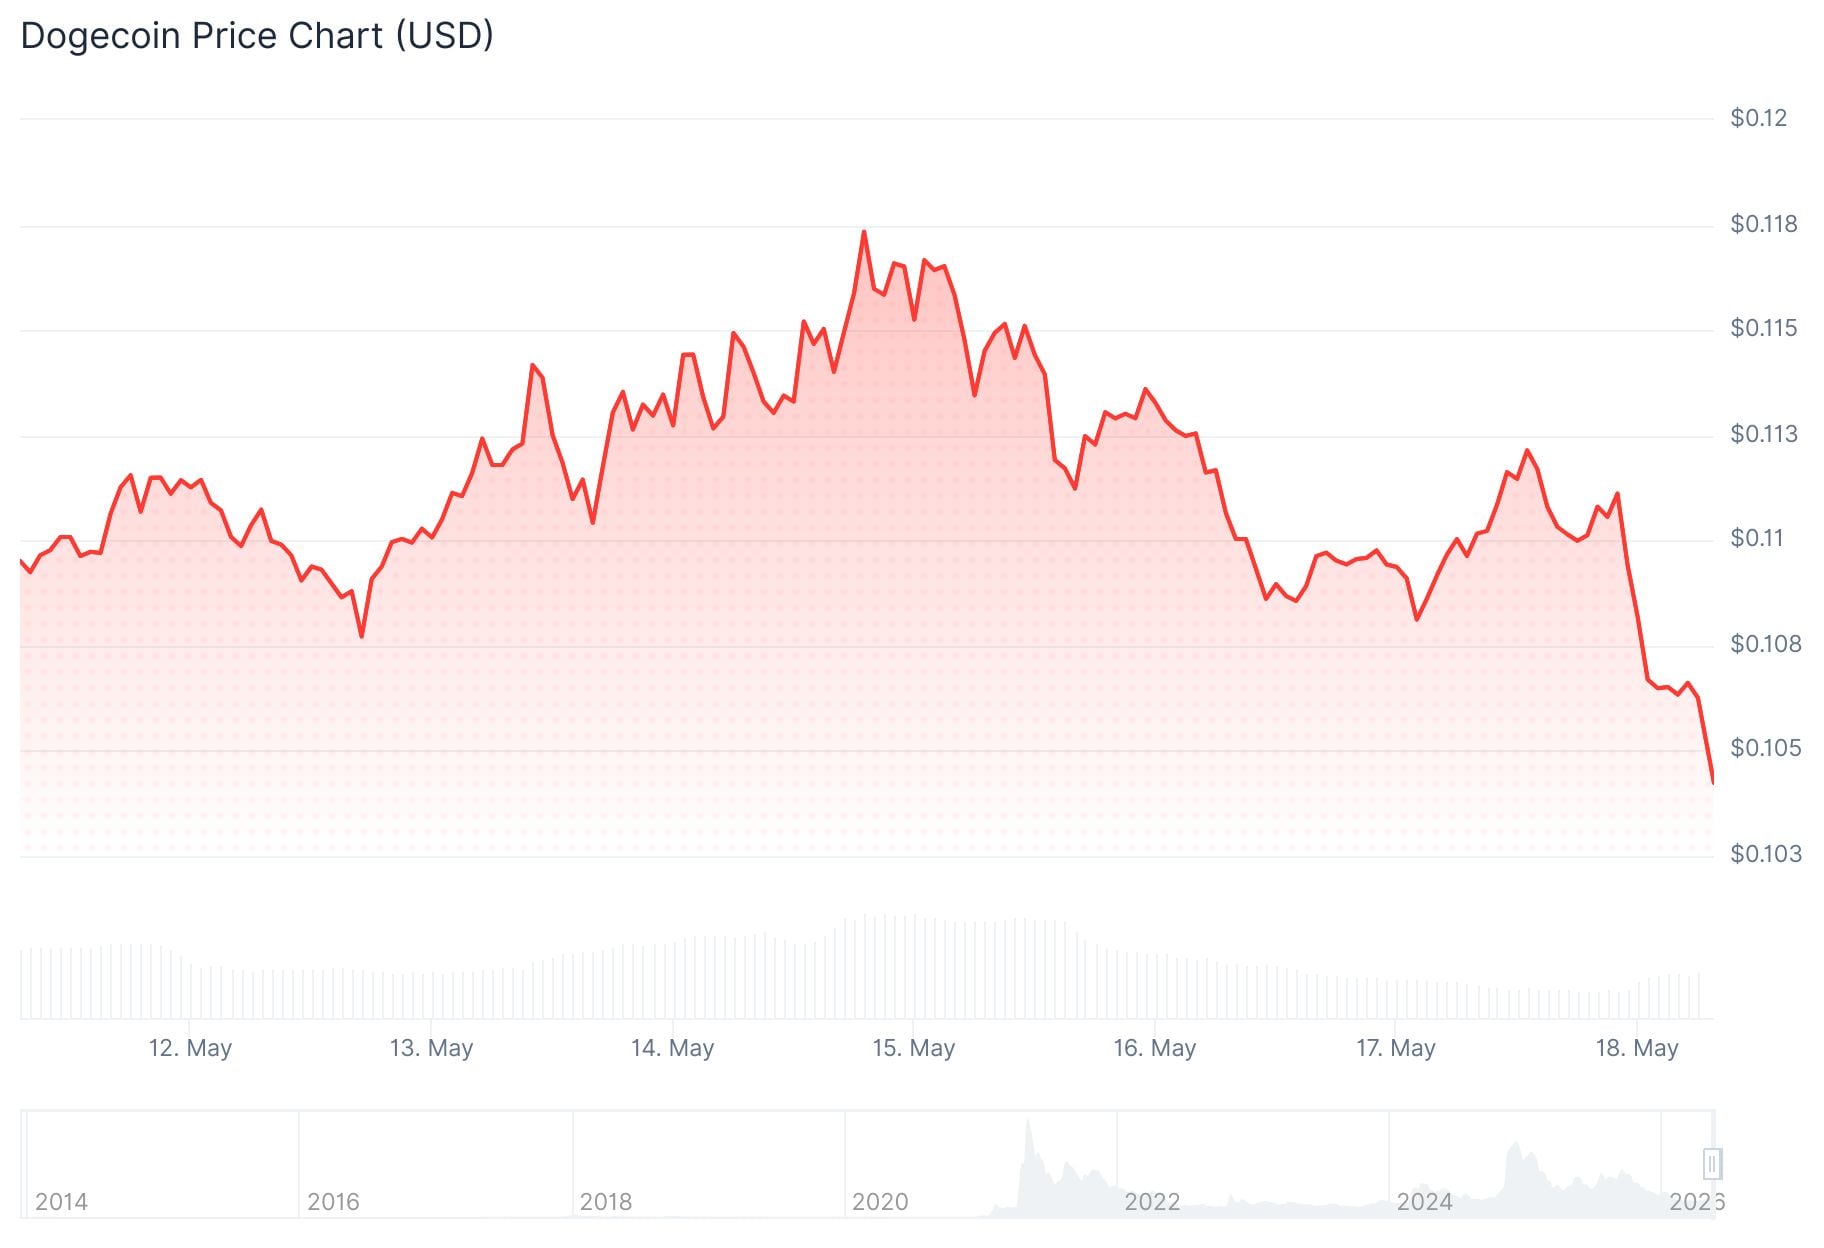
The price has been moving sideways for several sessions. There is no strong trend in either direction right now, but the chart structure is drawing attention from analysts.
Crypto analyst BitGuru posted on X on May 17, pointing out that DOGE has gone through a liquidity flush followed by a consolidation period. He said if momentum continues to build, the price could reach the $0.13–$0.15 range. BitGuru added that he is watching the setup closely for signs of a breakout.
I am still watching $DOGE very closely because the chart is showing a long consolidation phase after a major liquidity sweep and downtrend.
if momentum continues from here, we could see a strong breakout toward the $0.13 – $0.15 range pic.twitter.com/lyYPewt1jB
— BitGuru 🔶 (@bitgu_ru) May 17, 2026
On the weekly chart, DOGE recently bounced from the 0.786 Fibonacci support level near $0.08042. It has since climbed back toward the 0.618 Fibonacci resistance at $0.11799, which is now the key level to watch.
Analyst Surf noted that the correction looks healthy and that the $0.10 area should hold as support. He said the chart mirrors a setup from 2024, when DOGE bounced from a similar zone before making a larger move.
Key Levels to Watch
A weekly close above $0.11799 would be a positive signal. If that happens, the next resistance zones appear near $0.14 and $0.17, based on the current Fibonacci structure.

If DOGE fails to break that level, the $0.095–$0.10 range becomes the key support area to hold.
Cycle Bottom Comparison
Analyst Cryptollica offered a longer-term view, comparing the current price structure to previous cycle bottoms. He labeled past phases as “disbelief” in 2015, “boredom” in 2020, and “anger” in 2022. He described the current phase as another sentiment reset, where interest and momentum have cooled before a potential larger move.
DOGE | The 4th Cycle Bottom
This is not just a dogecoin:native call.
It is a cycle psychology example.This morning I wrote that charts are human behavior recorded over time.
This is the cleanest examples of that idea working in real time.
Cycle 1: 2015. Disbelief.
Cycle… pic.twitter.com/SWUUs3zu2X— Cryptollica (@Cryptollica) May 16, 2026
This does not signal an immediate breakout. It adds context to where DOGE sits in a broader historical pattern.
On the derivatives side, open interest dropped 0.79% to $1.52 billion in the last 24 hours. Volume fell 39.17% to $1.62 billion, showing that many traders are on the sidelines.
The funding rate remained slightly positive at 0.0006%, suggesting some traders still expect upside in the near term.
DOGE has not confirmed a breakout. The 0.618 Fibonacci level at $0.11799 remains the next major test for the price.


