


TLDR
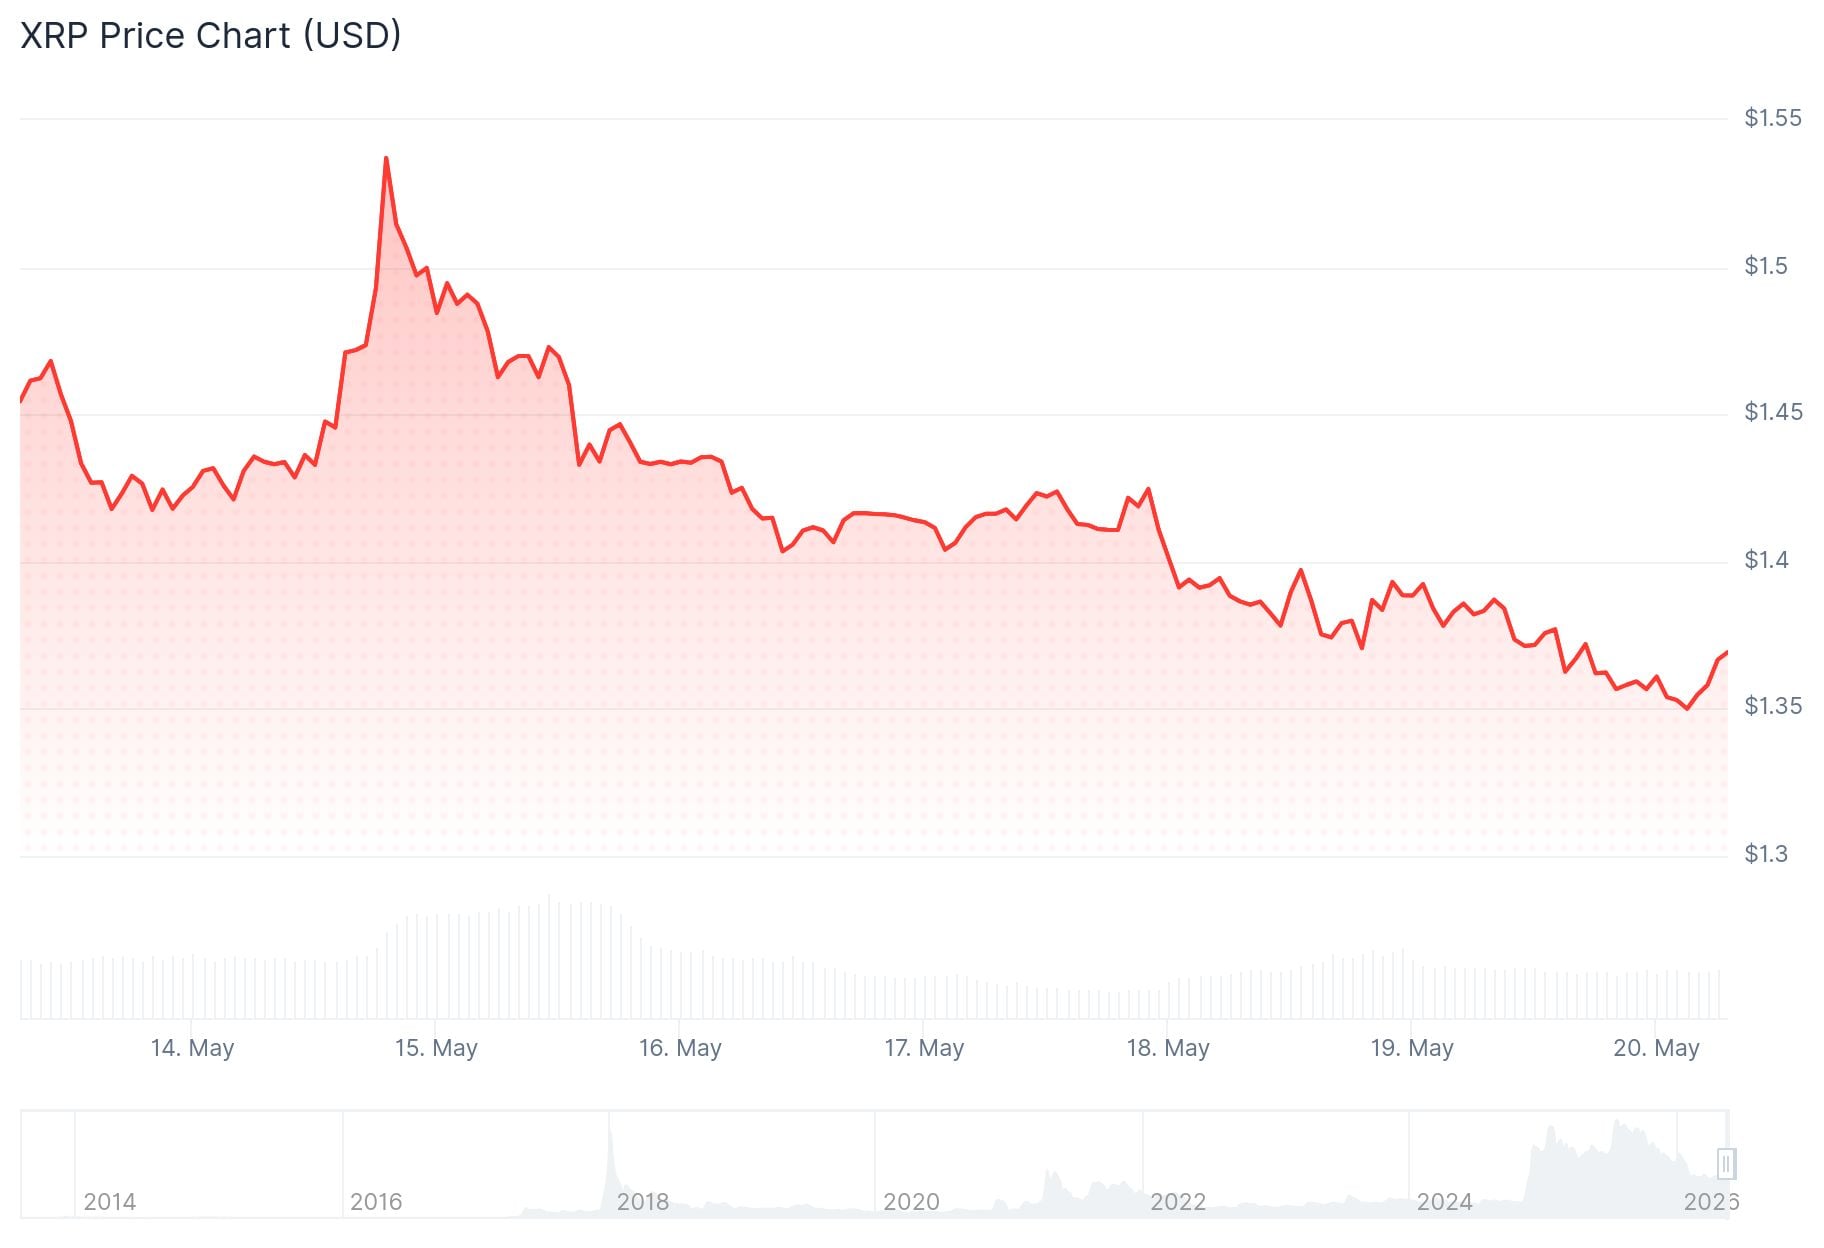
- XRP has fallen 12% over the last five days and broken below a key support level at $1.40
- A bear pennant pattern on the three-day chart sets a downside target of $0.65
- The weekly Stoch RSI has confirmed a “death cross” for the third time since the July 2025 all-time high
- Despite price weakness, XRP spot ETFs recorded nine straight days of net inflows totaling $95.5 million
- Institutional appetite for XRP outpaced Bitcoin and Ethereum in weekly ETP flows ending May 15
XRP is under pressure after falling 12% in five days and breaking below the $1.40 level. Technical patterns are now pointing to the possibility of further losses, while institutional demand through ETFs continues to grow.
XRP/USD has been consolidating inside a bear pennant on the three-day chart since early February. The pattern was confirmed when price broke below the lower trend line at $1.40. The measured downside target from this pattern sits near $0.65, which would represent a drop of about 52.5% from current levels.
The weekly Stoch RSI has also flashed a death cross signal. Technical analyst ChartNerd noted on X that this is the third time this signal has appeared since the July 2025 all-time high.
ChartNerd pointed out that the previous two death cross signals each produced corrections of around 50%. He added that “a failure at the weekly 20 (just retested) or the weekly 50 ($1.80) will likely open the next leg down later in the year.”
It's looking like $XRP may give us one final window of opportunity as we head deeper into 2026. An opportunity that has historically only printed 3 times in history, and every time the signal fired (2017, 2020, 2022), the Gaussian Channel sent XRP to new highs. 2026? 🤔 pic.twitter.com/bFa5BwLLsM
— 🇬🇧 ChartNerd 📊 (@ChartNerdTA) May 19, 2026
The daily RSI has dropped from 63 to 42 over the last seven days, reflecting growing bearish momentum.
On the hourly chart, a bearish trend line has formed with resistance at $1.3720. XRP is currently trading below $1.3880 and the 100-hourly Simple Moving Average.

Key resistance levels to watch are $1.3650, $1.3720, $1.3940, and $1.40. A clear move above $1.4250 would be needed to shift short-term momentum to the upside.
On the downside, initial support sits at $1.3465, followed by $1.3350. A close below $1.3350 could push XRP toward $1.3220 and then $1.3120.
Analysts have previously flagged $1.27 as a critical level. A close below it could send XRP toward $1.11 and eventually the $1.00 mark.
ETF Inflows Remain Steady
Despite the price decline, institutional demand has held up. US-based XRP spot ETFs recorded net inflows of $750,000 on Monday alone, extending a nine-day streak. Total inflows over that period reached $95.5 million, pushing cumulative inflows to nearly $1.4 billion and assets under management to $1.14 billion.
JUST IN: ETF clients buy $1.48 million worth of ripple:native, bringing total ETF-held net assets to $1.12 billion. pic.twitter.com/UkVYXXz1Em
— Whale Insider (@WhaleInsider) May 20, 2026
Crypto analyst account Whale Insider posted on X that “ETF clients buy $1.48 million worth of $XRP, bringing total ETF-held net assets to $1.12 billion.” The post highlights that institutional buying through regulated products has continued even as spot prices fall.
XRP Outperforms Bitcoin and Ethereum in ETP Flows
Global XRP investment products saw weekly inflows of $67.6 million for the week ending May 15. Bitcoin and Ethereum saw outflows of $981.5 million and $250 million respectively over the same period.
Total XRP ETF assets under management now stand at $1.14 billion, according to SoSoValue data.


