






TLDR
- Solana futures open interest fell 30% in May, from $2.75 billion to $1.90 billion.
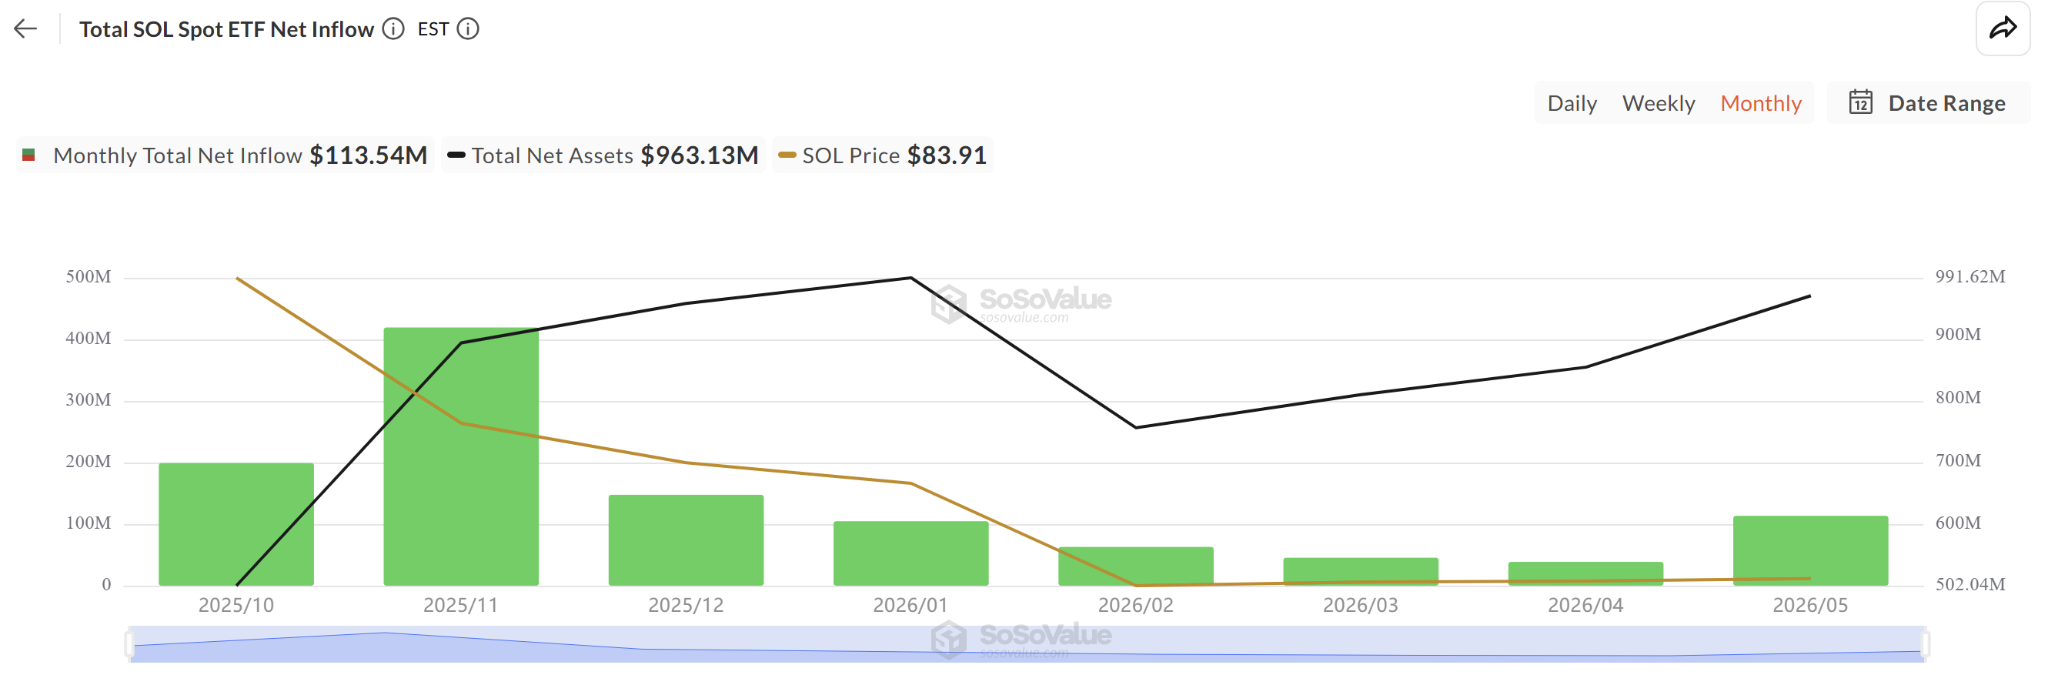
- SOL spot ETF inflows reached $113 million in May, the strongest monthly total of 2026.
- The price is trading near $80, the lower boundary of a three-month range between $80 and $95.
- A break below $80 puts focus on the yearly low near $68, where over $800 million in long liquidations sit.
- Geopolitical tensions between the US and Iran added selling pressure, briefly pushing SOL to $80.
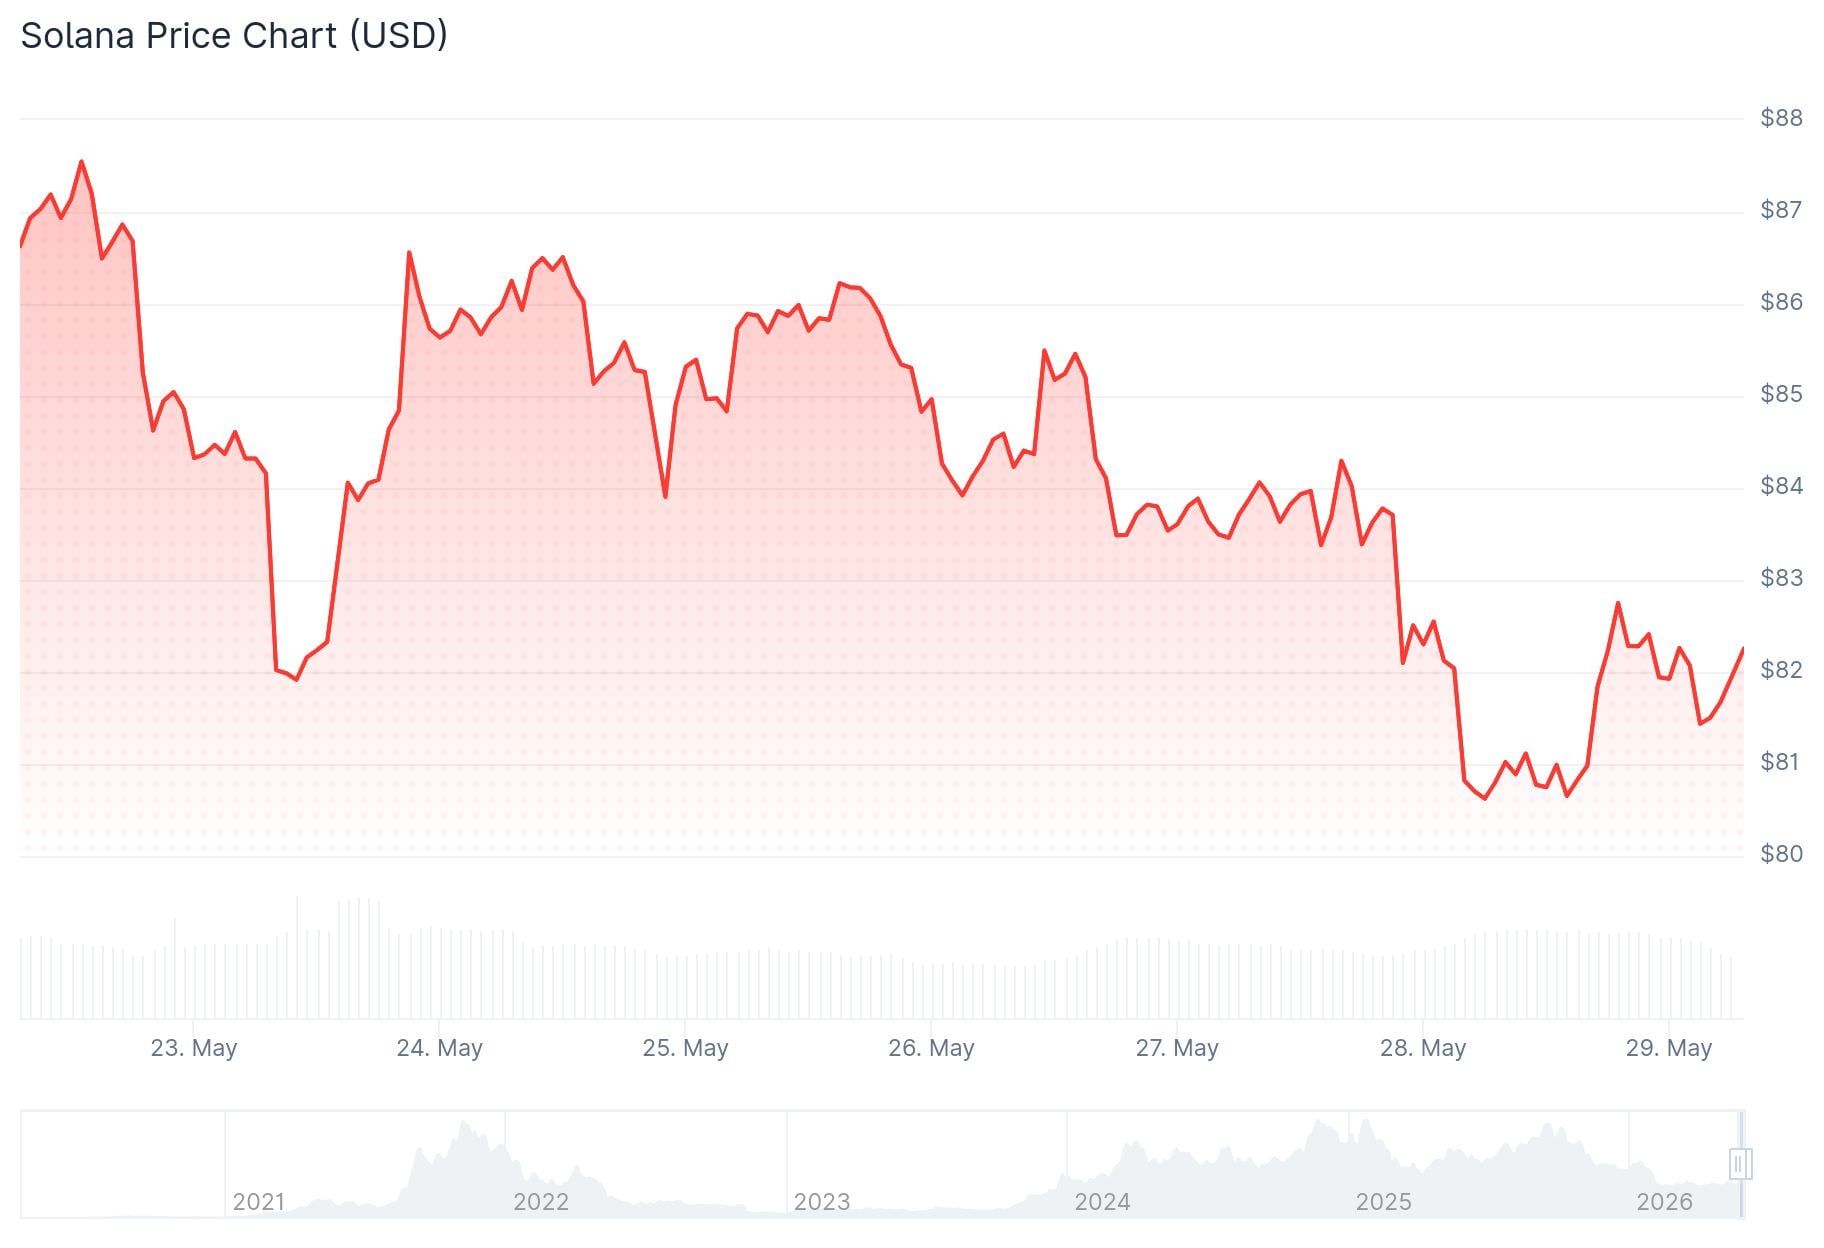
Solana (SOL) has been under pressure throughout May as traders pulled back on leveraged bets and broader market risk appetite fell. The price touched $80 on Thursday following a sharp crypto selloff triggered by reports of military strikes between the US and Iran.
Futures open interest across all exchanges fell to $1.90 billion from $2.75 billion on May 11, a drop of around 30% in just over two weeks. The aggregated funding rate held near -0.005, showing that neither bulls nor bears have built strong directional positions despite the price weakness.
The aggregated futures cumulative volume delta (CVD) for stablecoin-margined orders dropped to a yearly low of -$13 billion, pointing to steady sell-side pressure in the derivatives market through May.
Analyst Sjuul from AltCryptoGems posted on X that SOL “looks very weak,” pointing to the rejection at $98 and the resulting downtrend. He noted that key levels have flipped into resistance, especially $88, and said a move toward the $76 support zone is likely if sellers stay in control. He added that bulls would need to reclaim $88 to change the picture.
$SOL looks very weak.
After the rejection at $98, price has started to downtrend lower and lower. Key levels have flipped into resistance, especially $88.
Now price is clearly back in the consolidation range, so there’s not much to do: if sellers stay in charge, a move toward… pic.twitter.com/QHj19DnpOb
— Sjuul | AltCryptoGems (@AltCryptoGems) May 28, 2026
Spot Buyers Hold Steady Despite Derivatives Weakness
Despite the futures market weakness, spot activity has been more resilient. Spot CVD improved to $350 million since March, showing that buyers on spot exchanges kept absorbing supply even as derivatives traders reduced exposure.
SOL spot ETF inflows added to that picture. Net inflows reached $113 million in May, making it the strongest monthly total for SOL ETFs in 2026. The combination of falling futures interest and steady spot buying typically points to reduced speculative appetite rather than outright panic.

Crypto trader Cold Blooded Shiller described SOL as one of the weaker large-cap charts in the market, noting that it has been in a downtrend since October and has little strong support below $80.
Price Holds at the $80 Floor
From a technical standpoint, Solana has been trading inside a range between $80 and $95 since falling 42% during Q1. The lower boundary of that range was tested again on Wednesday and Thursday.
Perpetual futures funding rates have flipped negative, sitting around -0.0088% according to Coinglass, which points to short sellers remaining dominant.
The RSI is approaching oversold territory, while the MACD remains below its signal line, showing that bearish momentum has not reversed. Immediate resistance sits at the 50-day and 100-day simple moving averages.
Crypto commentator Zoe placed bids near $67, which aligns with the yearly low and the largest cluster of leveraged liquidation positions on the open interest heatmap.
More than $800 million in cumulative long leverage sits near the $68 zone. That is the key level to watch if downside pressure continues.


