






TLDR
- XRP is trading around $1.09, down over 6% in the past month
- Whale transactions over $1M on the XRP Ledger dropped from ~70 to just 2
- Most moving averages sit above price, generating widespread sell signals
- The $1.00–$0.95 zone is the key support area traders are watching
- A drop below $0.90 could open the door to deeper losses toward $0.44
XRP is holding just above $1.09 on Bitstamp, but the broader trend has been pointing lower for weeks. The altcoin is down 2.23% in the past 24 hours, 4.24% over the past week, and 6.83% over the past month.
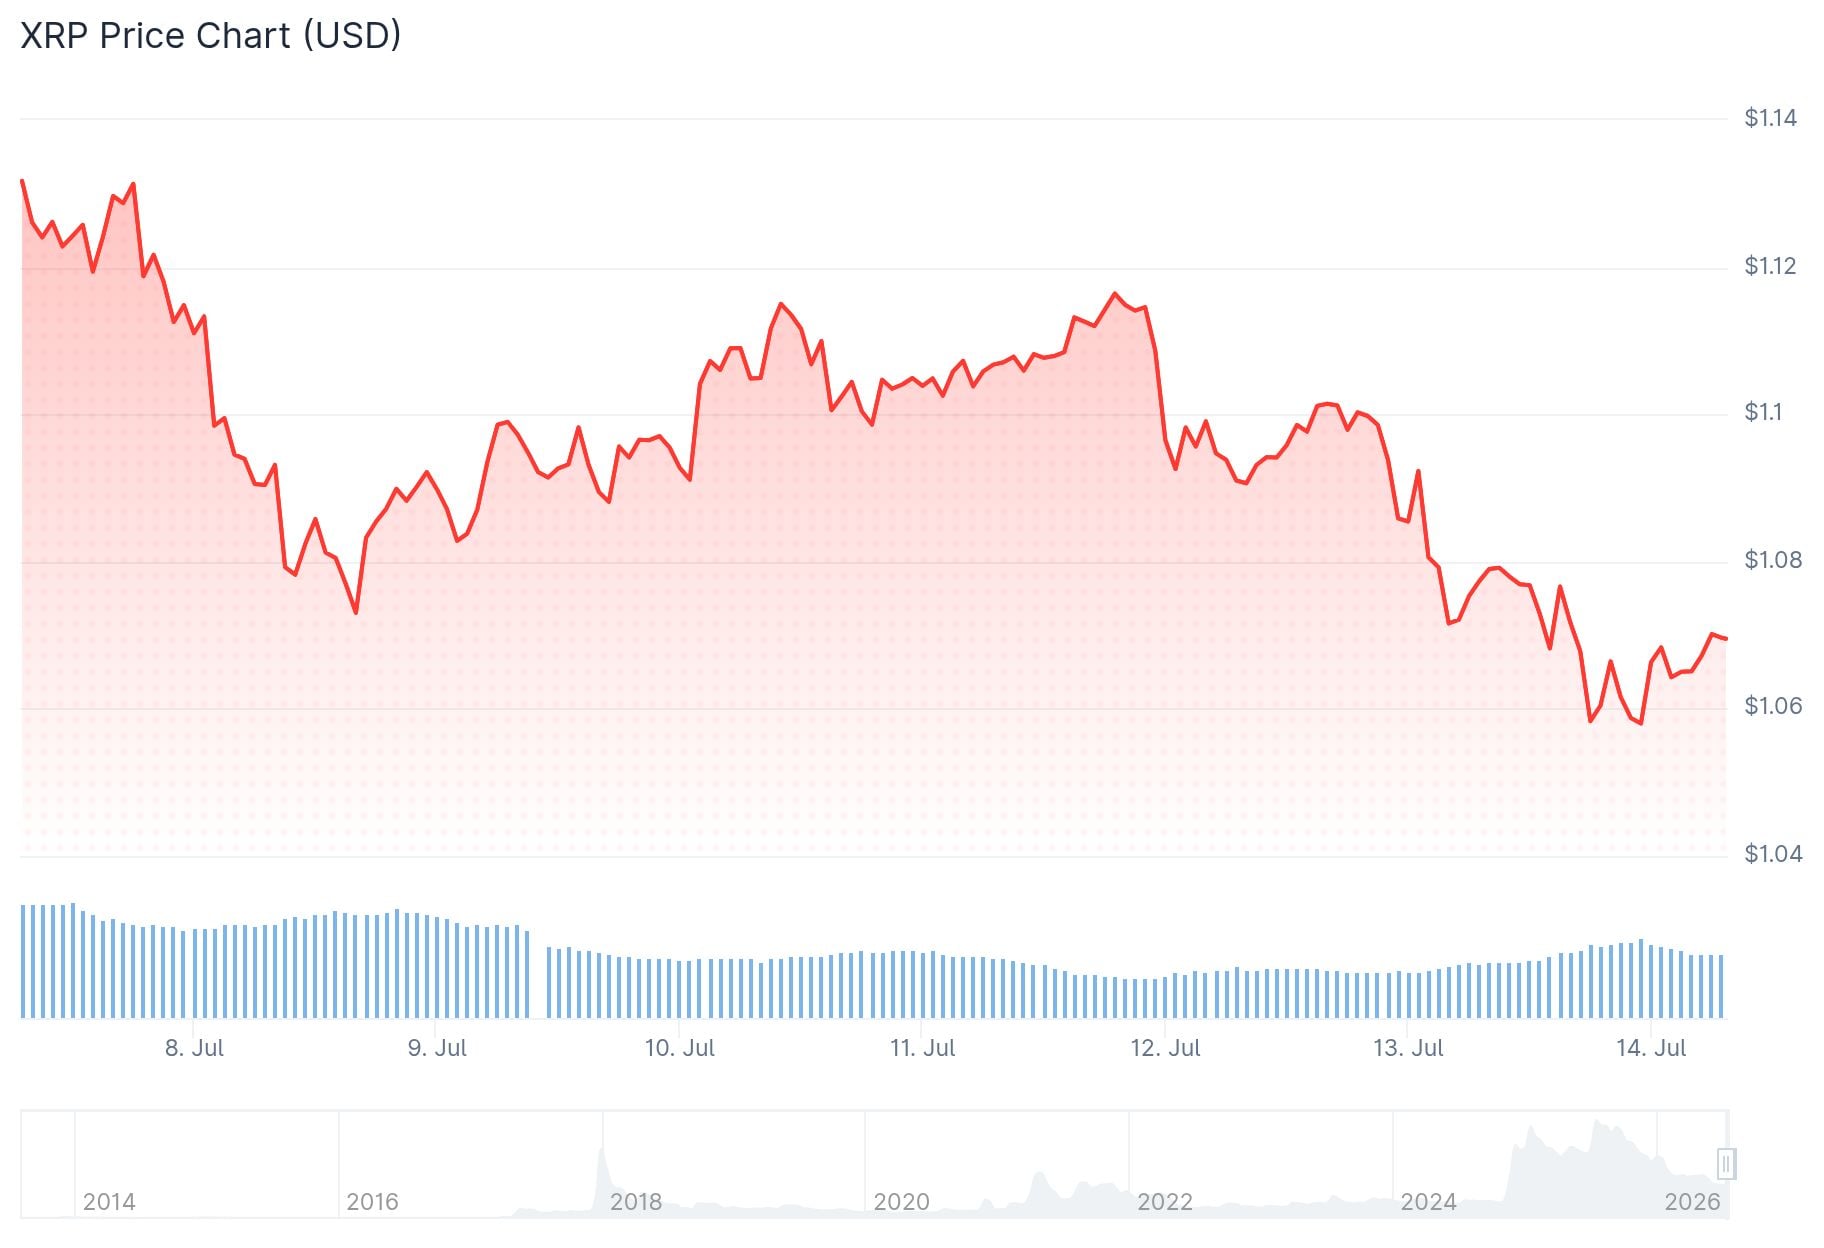
The price decline stretches back to August 2025, when XRP set a swing high of $3.66. Since then, the trend has been consistently downward.
Trader attention is now locked on the $1.00 support level. This zone was a major breakout point roughly two years ago, making it historically meaningful for many market participants.
On the four-hour chart, XRP is also approaching support near $0.95. Analysts have noted what looks like an ending diagonal pattern forming — a setup that can signal trend exhaustion.
Market analyst @ew-forecast noted the pattern “could signal that selling pressure is starting to mature,” but added that the broader market structure remains bearish without a confirmed reversal.
Whale Activity Falls Off a Cliff
On-chain data is raising eyebrows. According to Santiment data shared by analyst Ali Martinez, daily XRP Ledger transactions worth more than $1 million dropped from around 70 earlier in the week to just 2.
Whale activity on the $XRP Ledger has cooled significantly.
The number of transactions worth more than $1 million has dropped from 70 over the past week to just 2 today. pic.twitter.com/th3C7vEkT2
— Ali Charts (@alicharts) July 12, 2026

This doesn’t automatically mean large holders are selling. It points more to inactivity — large investors appear to be sitting on the sidelines waiting for clearer signals before making moves.
Open Interest has also been falling, which reflects a reluctance among derivatives traders to place directional bets. Exchange reserves are trending lower too, which can hint at accumulation, though not necessarily a quick price recovery.
Analyst Celal Kucuker posted on X, highlighting an RSI divergence on XRP. He stated simply: “A strong rally could be about to begin.” The divergence is worth watching, though it hasn’t translated into buying pressure yet.
$XRP is showing an RSI divergence.
A strong rally could be about to begin.
Hear it here first. pic.twitter.com/yMRgncE5qx
— Celal Kucuker (@CelalKucuker) July 13, 2026
Technical Indicators Stay Bearish
TradingView’s composite rating for XRP sits at Neutral, but the breakdown shows 14 sell signals, 10 neutral, and just 2 buy signals. The RSI stands at 43.45, below the neutral 50 mark. The ADX reads 14.74, suggesting the current trend lacks strong directional force.
Key Levels to Watch
Most exponential and simple moving averages — from the 10-period to the 200-period EMA — are positioned above current price, all generating sell signals. The EMA 200 sits at $1.468, well above where XRP is trading now.
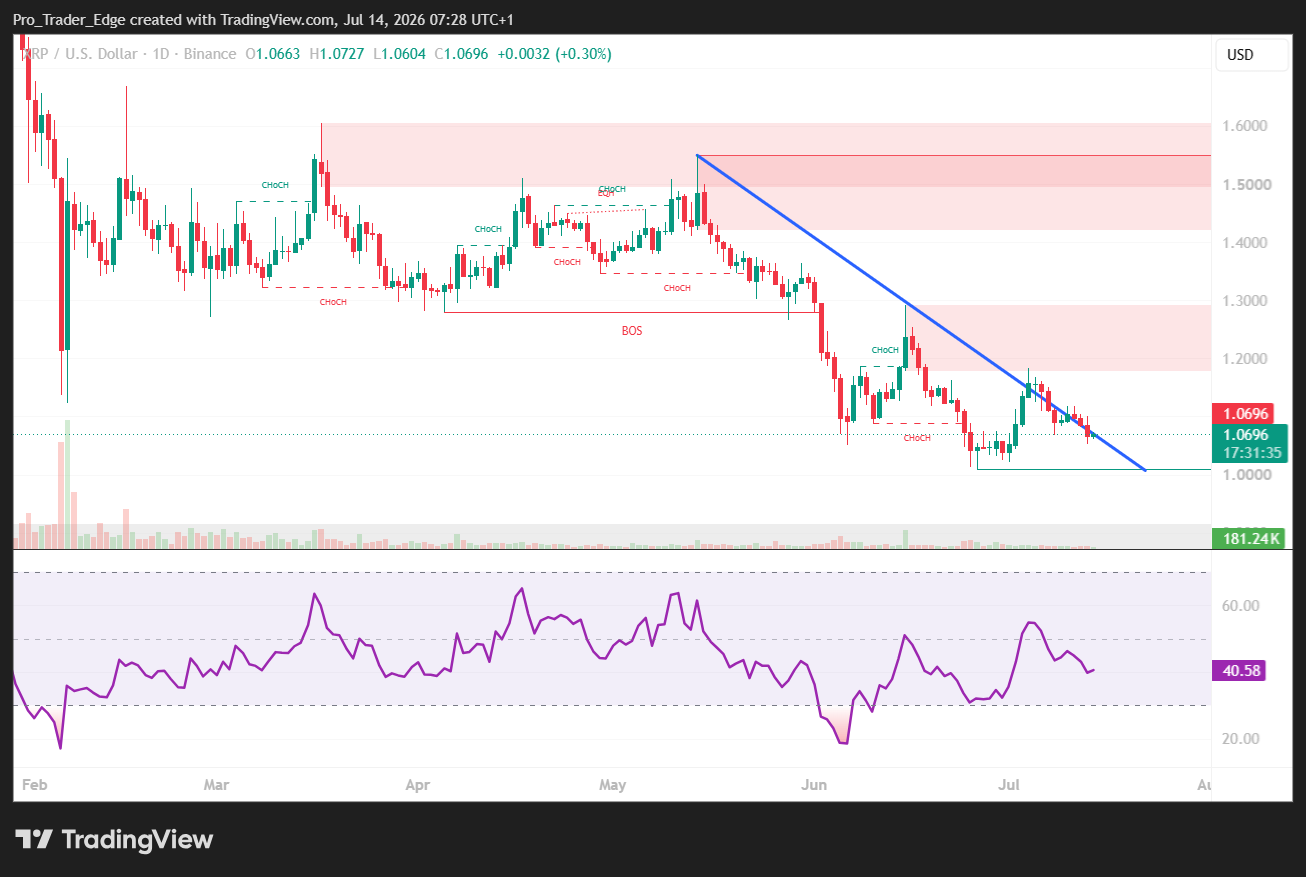
Key support levels are $1.00, $0.95, $0.85, and $0.60. If price breaks below $0.90, the next meaningful floor could be as low as $0.44, based on historical drawdown averages from previous cycles noted by analyst Chart Nerd.
Resistance sits between $1.10 and $1.13, where several moving averages converge.
The most recent data shows whale activity near historic lows for this period, with just 2 large transactions recorded on the XRP Ledger in the latest session.


