






TLDR
- Ethereum ETFs logged $70.62 million in net outflows on Friday, snapping a five-day inflow streak
- ETH still posted $103.9 million in net inflows for the week, extending its weekly inflow streak to three
- ETH/BTC ratio dropped to 0.028, its lowest level since last August
- On-chain data shows ETH is trading below its aggregate cost basis of $2,304, historically exhausting sellers
- Key bottom metrics like MVRV and exchange inflows have not yet reached extreme levels that confirm a floor
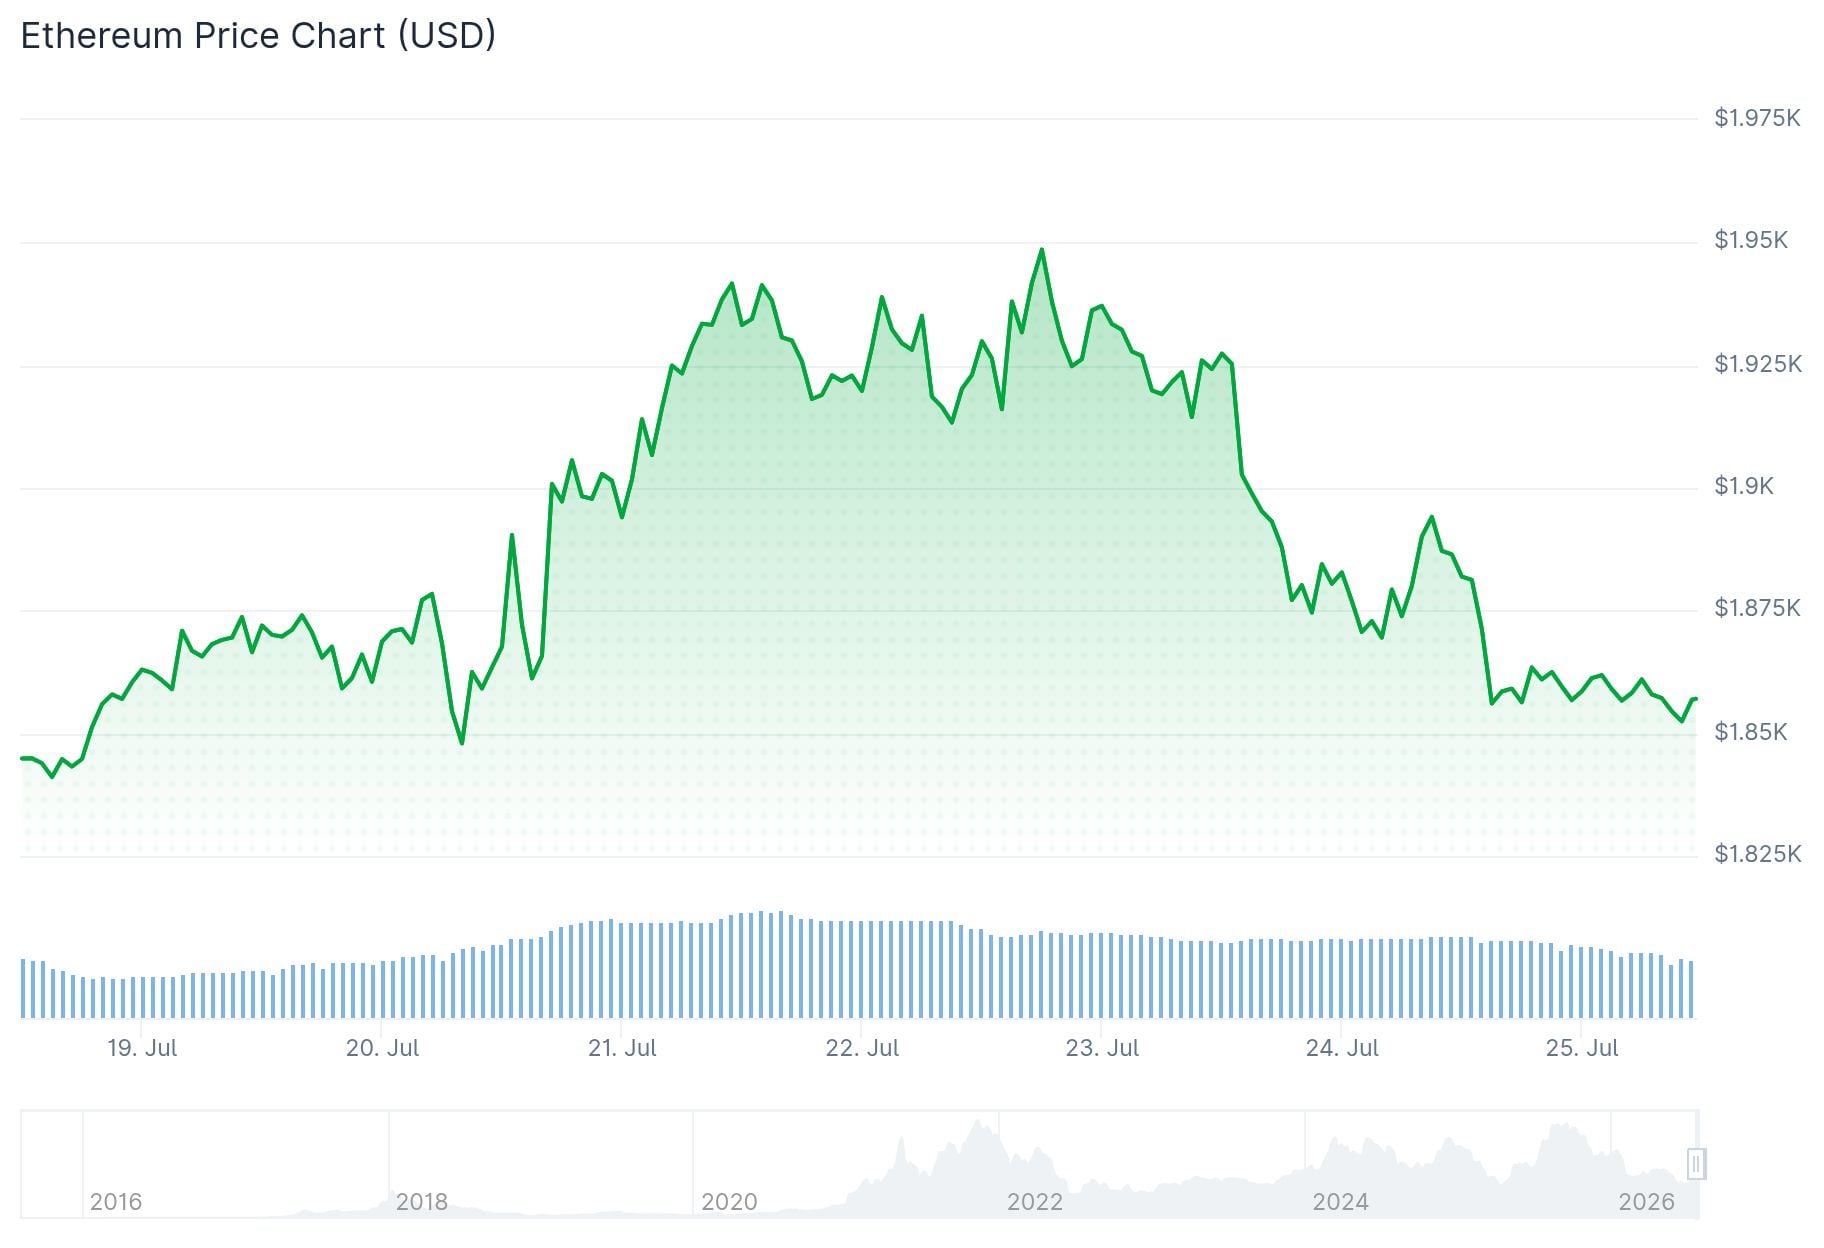
Ethereum (ETH) ended the week at $1,837 after US-listed spot Ethereum ETFs recorded $70.62 million in net outflows on Friday, July 25. That broke a five-day inflow streak that had brought in $211.25 million between July 17 and July 24.
Despite the Friday reversal, Ethereum ETFs still posted $103.9 million in net inflows for the full week. That extended their weekly inflow streak to three consecutive weeks. Total July inflows for ETH ETFs now stand at $337.74 million.
Bitcoin ETFs followed a similar pattern. They recorded $240.08 million in net outflows on Friday, ending a seven-day inflow streak. BTC was trading just under $64,000, down from a weekly high of $66,892 on Tuesday.
U.S. Spot Bitcoin and Ethereum ETFs Record Net Outflows on July 24
According to SoSoValue data, spot Bitcoin ETFs recorded total net outflows of $240 million on July 24 (ET). Spot Ethereum ETFs saw total net outflows of $70.62 million on the same day, ending a five-day streak of… pic.twitter.com/qvg2L12fD6
— Wu Blockchain (@WuBlockchain) July 25, 2026
Analyst Ted (@TedPillows) noted on social media that ETH is still holding above its support zone. He said Ethereum is looking strong compared to Bitcoin and believes the rally may not be finished yet.
$ETH is still holding above its support zone.
As compared to Bitcoin, Ethereum is looking strong, and I think the rally isn't done yet. pic.twitter.com/dMob6RxqPS
— Ted (@TedPillows) July 25, 2026
ETH has fallen sharply from its all-time high of $4,946 last year to a low of $1,400 in June before recovering. It is currently trading roughly 17% below its realized price, or the average on-chain cost basis of all ETH tokens, which sits at $2,304.

ETH Bottom Signals: What the Data Shows
According to a CryptoQuant report released Thursday, Ethereum is showing early signs of a market bottom but has not yet confirmed all the signals needed for a sustained rally.
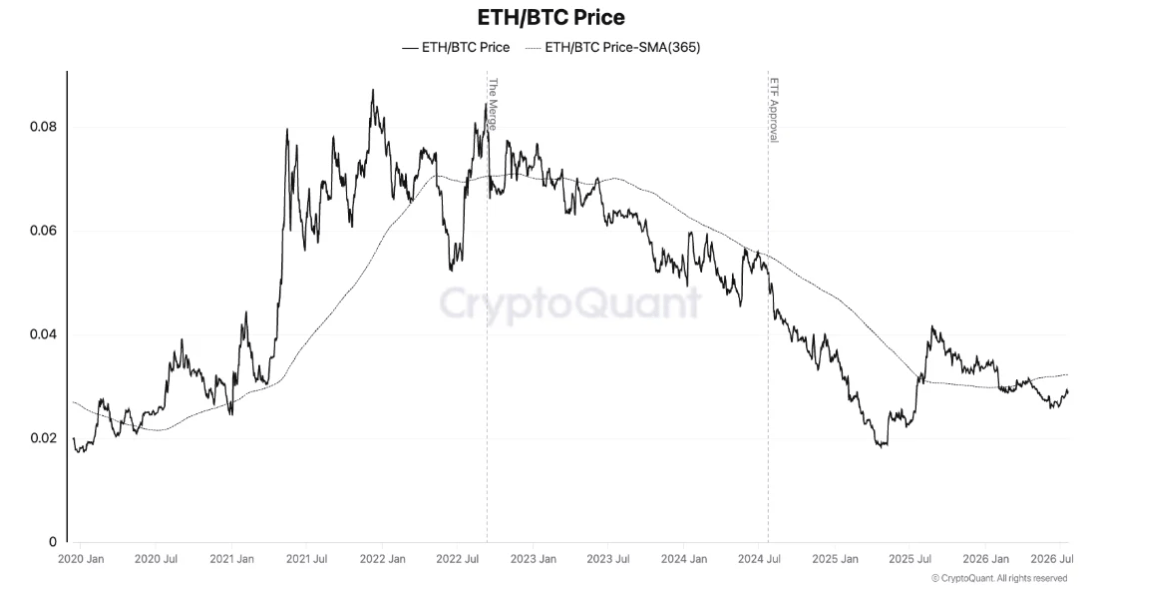
The ETH/BTC ratio has dropped to 0.028, its lowest since last August. This kind of underperformance against Bitcoin has historically preceded broader altcoin seasons, but analysts say more confirmation is needed.
The ETH/BTC MVRV ratio has declined from 0.95 last August to around 0.65. CryptoQuant says a durable bottom typically forms when this drops below 0.45, a level seen in 2019-20 and early 2025.
ETH Technical Levels to Watch
Ethereum is currently testing its 20- and 50-day Exponential Moving Averages (EMAs) at $1,839 and $1,831. A break below those levels could expose support near $1,806, then $1,741.
ETH recorded $67.79 million in liquidations over the past 24 hours, with $44.18 million coming from long positions.
One metric is already flashing a bottom signal. The ETH/BTC relative spot trading volume has dropped from 1.75 in August to around 0.5, a level that has historically lined up with ETH price bottoms.
ETF institutional demand has also begun to turn, with the ETH/BTC ETF holdings metric recovering to 0.13 in July after falling to 0.115 in June.


