


 Price: Trading Volume Surges 150% as PI Coin Breaks Key Resistance")


TLDR
- PI Network token broke above horizontal channel resistance with 16% intraday gains, signaling potential bullish breakout
- Trading volume surged nearly 150% to $270 million, supporting the price rally and reducing false breakout chances
- PI price moved above 20-day EMA at $0.4038, confirming growing demand and short-term bullish momentum
- Current price trades near $0.413, down 4% after rejection from $0.46 resistance zone and upper Bollinger Band
- Price targets $0.52 if momentum continues, with support at $0.3773 if profit-taking occurs
Pi coin recently completed a breakout above its horizontal channel resistance. This move came after the cryptocurrency climbed 2% with trading volume jumping nearly 150%.
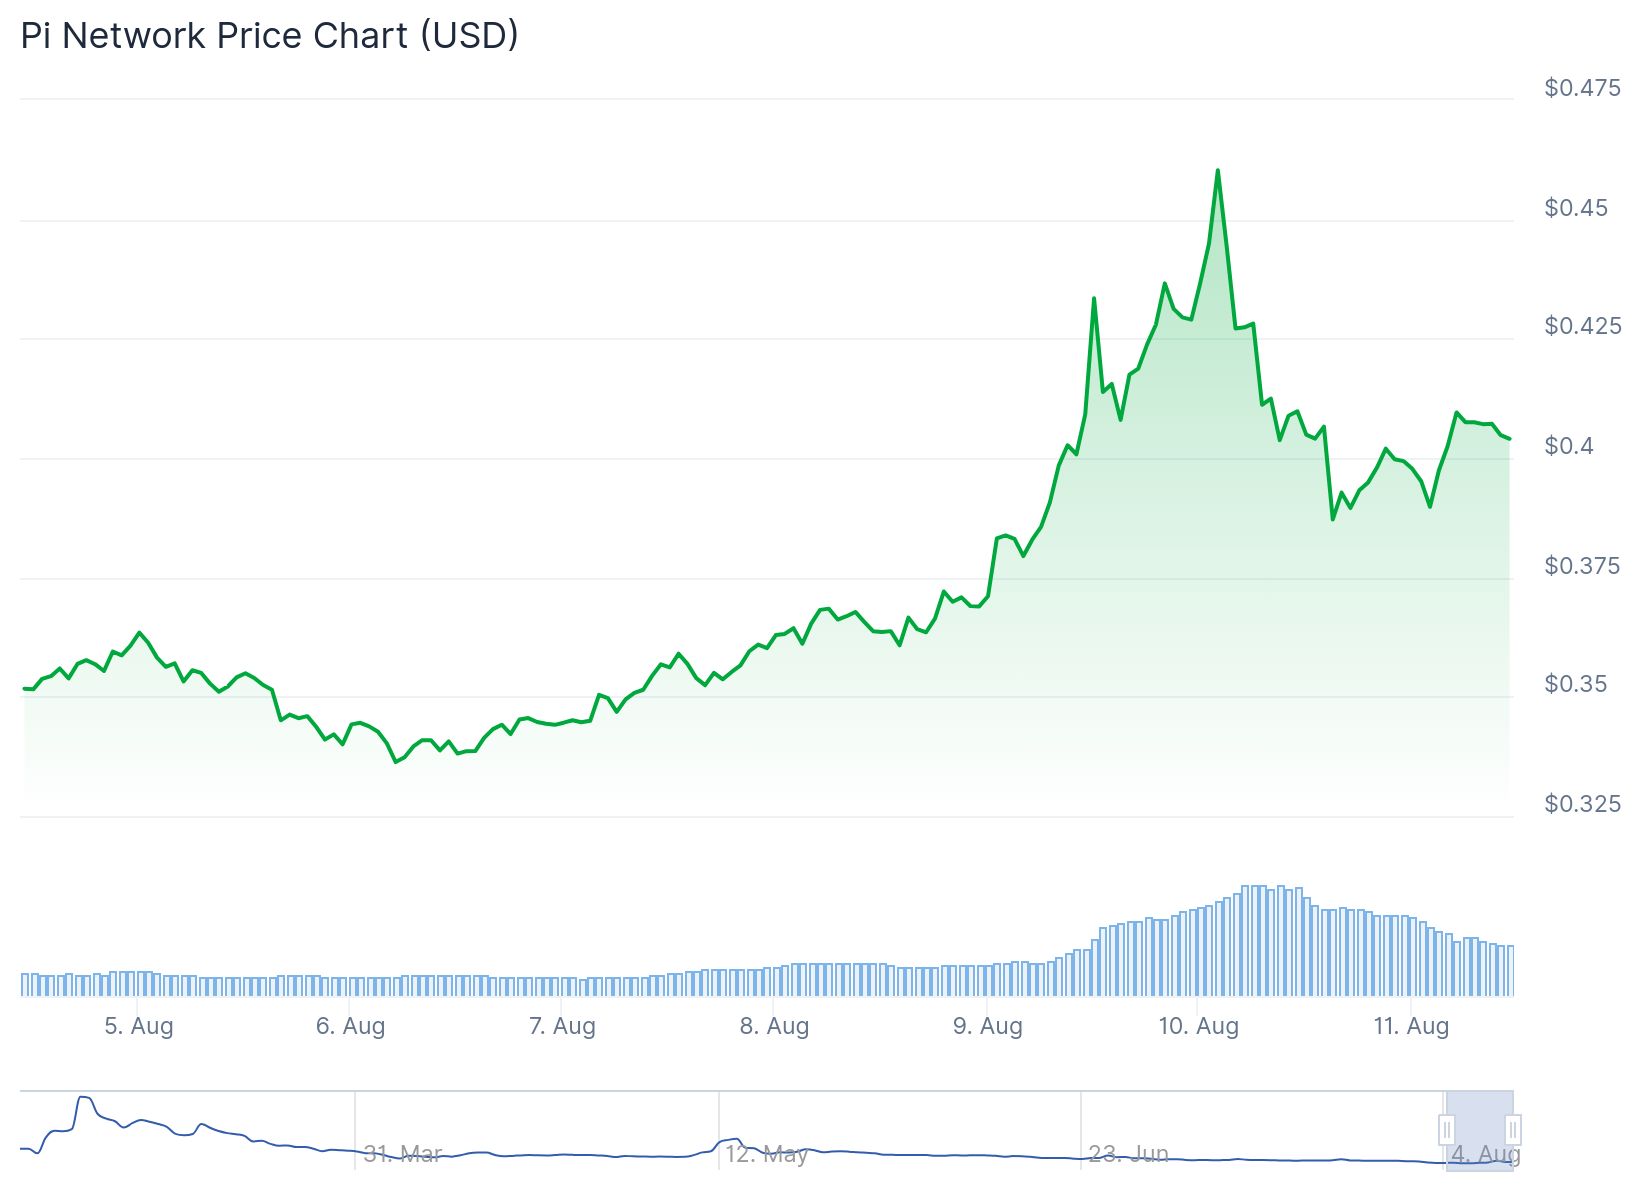
The breakout occurred when PI closed above the upper boundary of its horizontal channel on Saturday. This channel had contained price movements between August 2 and August 8.
During yesterday’s session, the breakout generated 16% gains for PI holders. The move suggests renewed bullish sentiment among traders.
Today’s price action shows PI coin price maintaining momentum with a 2% increase. Trading volume reached $270 million by press time, representing a nearly 150% surge over 24 hours.
The combination of rising price and increased volume confirms trend strength. More participants are actively buying, which supports the current price movement.
PI’s price now trades above its 20-day exponential moving average at $0.4038. This technical indicator measures average price over the past 20 trading days, giving more weight to recent prices.
When an asset trades above its 20-day EMA, it typically indicates growing short-term bullish momentum. The EMA now provides dynamic support beneath the current price level.

PI Coin Price Prediction
The current price sits near $0.413, representing a 4% decline from recent highs. Pi encountered strong resistance at the $0.46 level, which coincides with a 4-hour supply block.
This resistance zone also aligns with the upper Bollinger Band, creating multiple layers of overhead pressure. The rejection occurred after a multi-day rally from the $0.326 low.
On the daily chart, PI remains within a broader downtrend. Descending trendline resistance continues to cap upside movement since May.
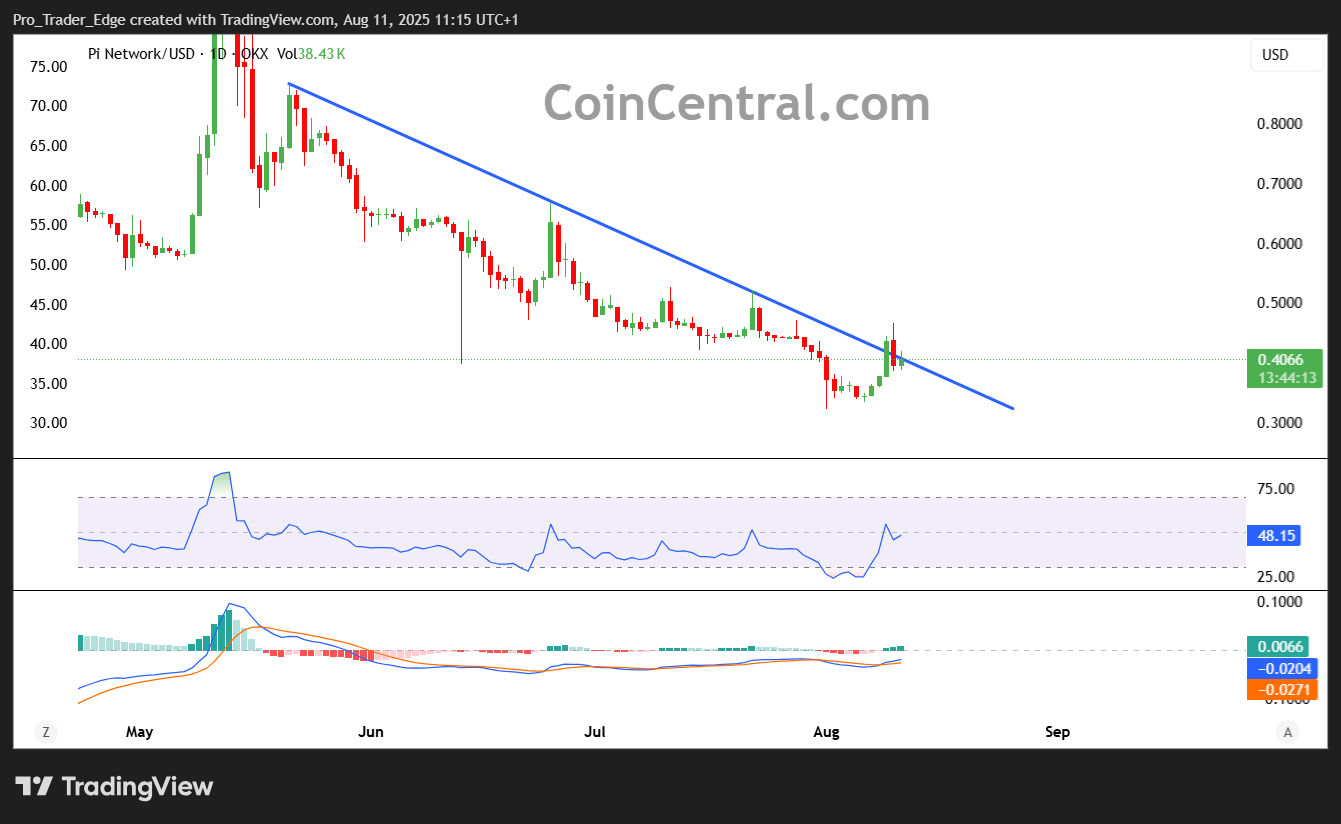
The recent rally broke above short-term dynamic levels but stalled at the confluence of the $0.46 supply zone. The daily EMA cluster also provided resistance at this level.
On-Balance Volume remains near multi-month lows despite the recent price spike. This suggests broader accumulation remains weak among institutional players.
The 4-hour chart shows price pushed above the 20 EMA at $0.391 and 50 EMA at $0.384. However, sellers successfully defended the 200 EMA at $0.4287.
If buying momentum continues, PI could target the key resistance level at $0.4451. A successful break above this barrier may push price toward $0.5281.
Conversely, profit-taking could send PI back to support near $0.3773. The mid-Bollinger Band at $0.4402 now acts as immediate resistance following the recent rejection.
Pi Network currently trades near $0.413 with volume remaining elevated at $270 million over the past 24 hours.


