


TLDR
- XRP has dropped 16.8% over the past 30 days, trading at $2.93
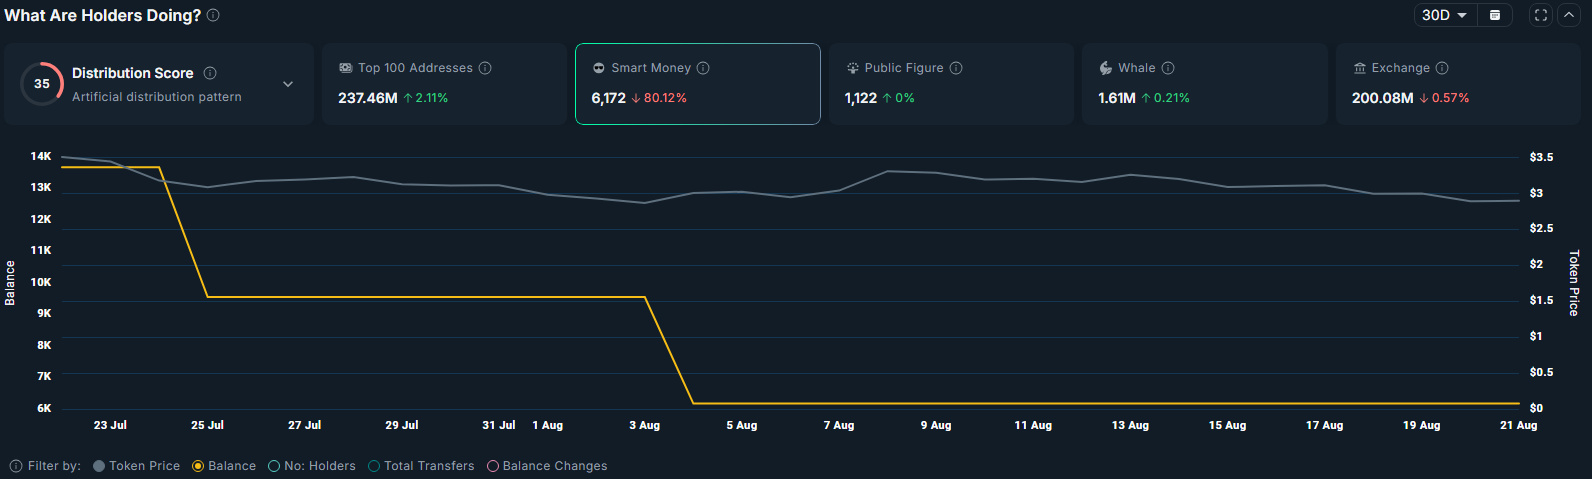
- Smart money investors reduced XRP holdings by 80% in the last month
- Network activity declined with weekly transactions down 14.8% and active addresses falling 2.1%
- Technical analysis shows bearish patterns with price breaking below key support levels
- Futures traders turned bearish with open interest dropping from $10.94 billion to $7.56 billion
XRP price continues to face downward pressure as the token trades at $2.93, marking a 16.8% decline over the past month. The third-largest cryptocurrency by market cap maintains a valuation of $173.8 billion with daily trading volume reaching $6.4 billion.
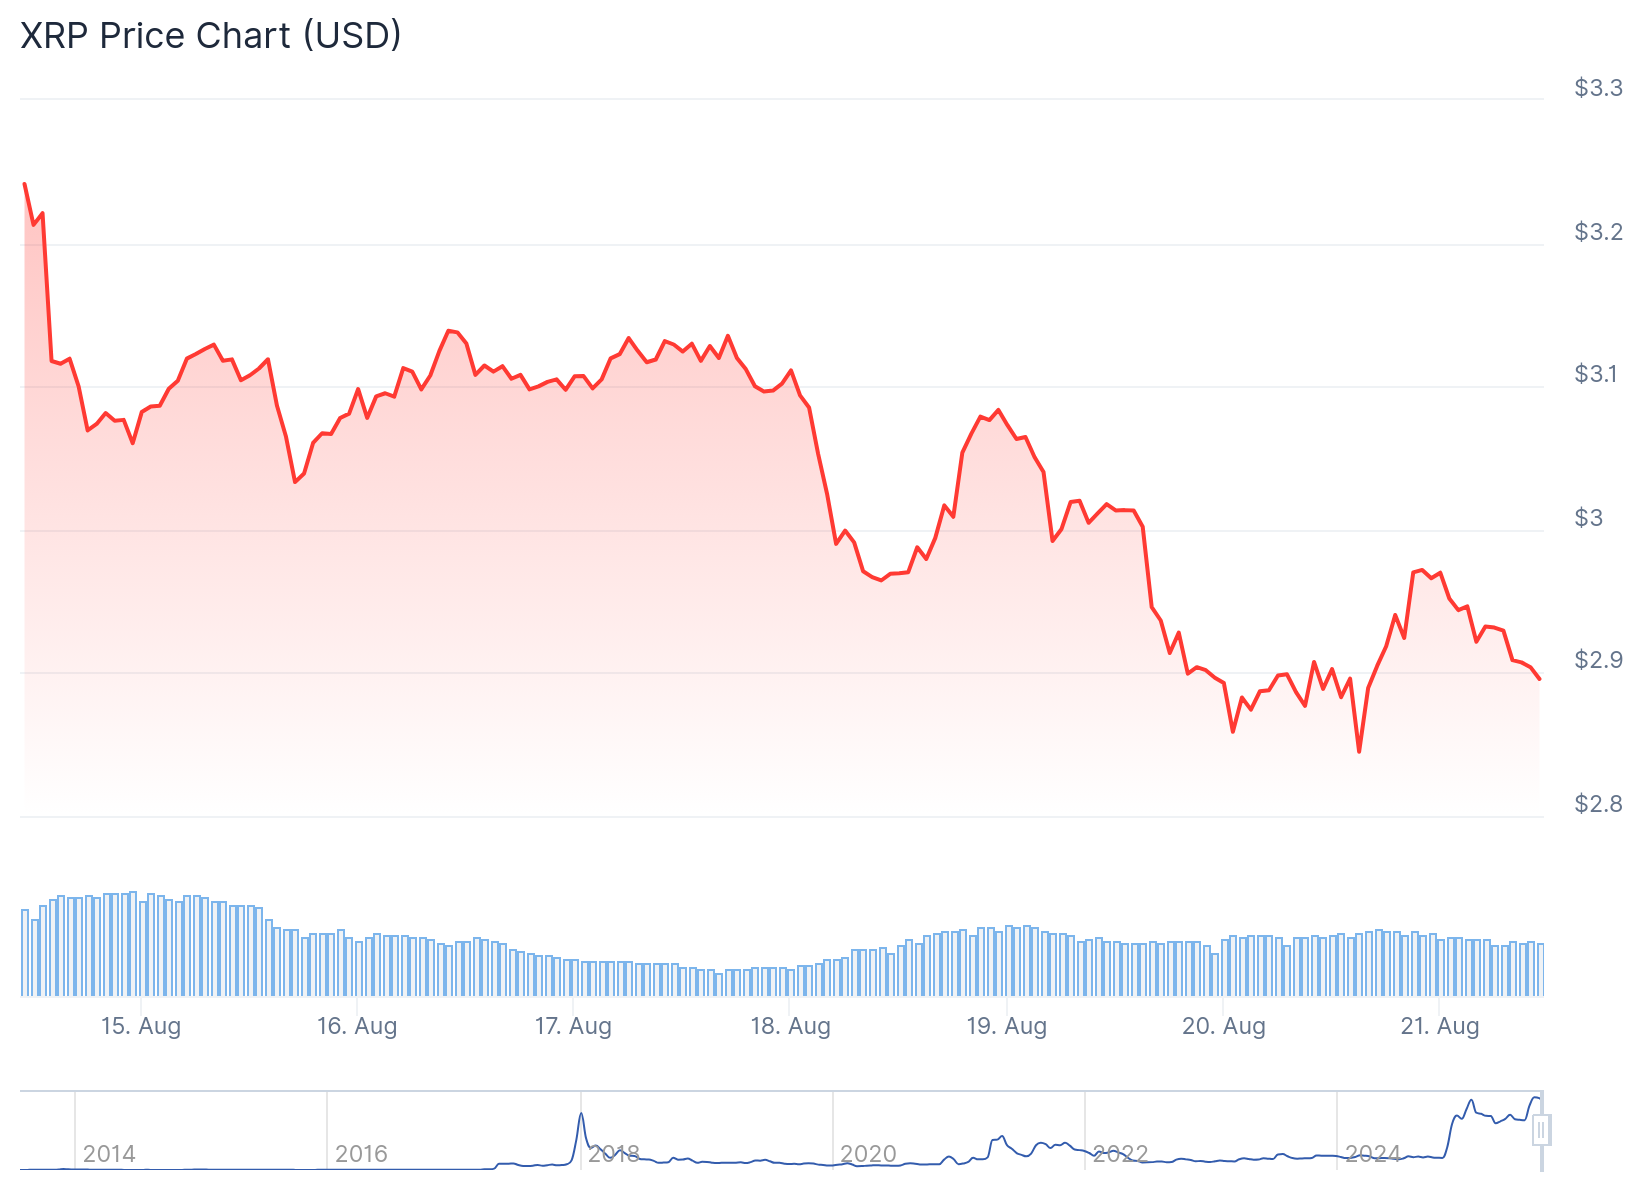
Despite earlier gains of 63% from its year-to-date low, XRP has struggled to maintain momentum after reaching its yearly peak last month. The token remains 19% higher over the last three months, but recent data suggests further corrections may lie ahead.
Smart money investors have reduced their XRP exposure by nearly 80% over the past 30 days, according to Nansen data. This reduction often precedes broader market weakness as retail investors typically follow institutional moves.
The futures market reflects growing bearish sentiment among traders. Open interest for XRP declined from $10.94 billion in July to $7.56 billion at press time. The long/short ratio has dropped below 1, indicating more traders are positioning for potential downside moves.
XRP Price Prediction
XRP price has broken below the 20-day and 50-day moving averages on the daily chart, confirming bearish momentum. The token also formed a descending triangle pattern with a measured target of $2.40, representing an 18% drop from current levels.
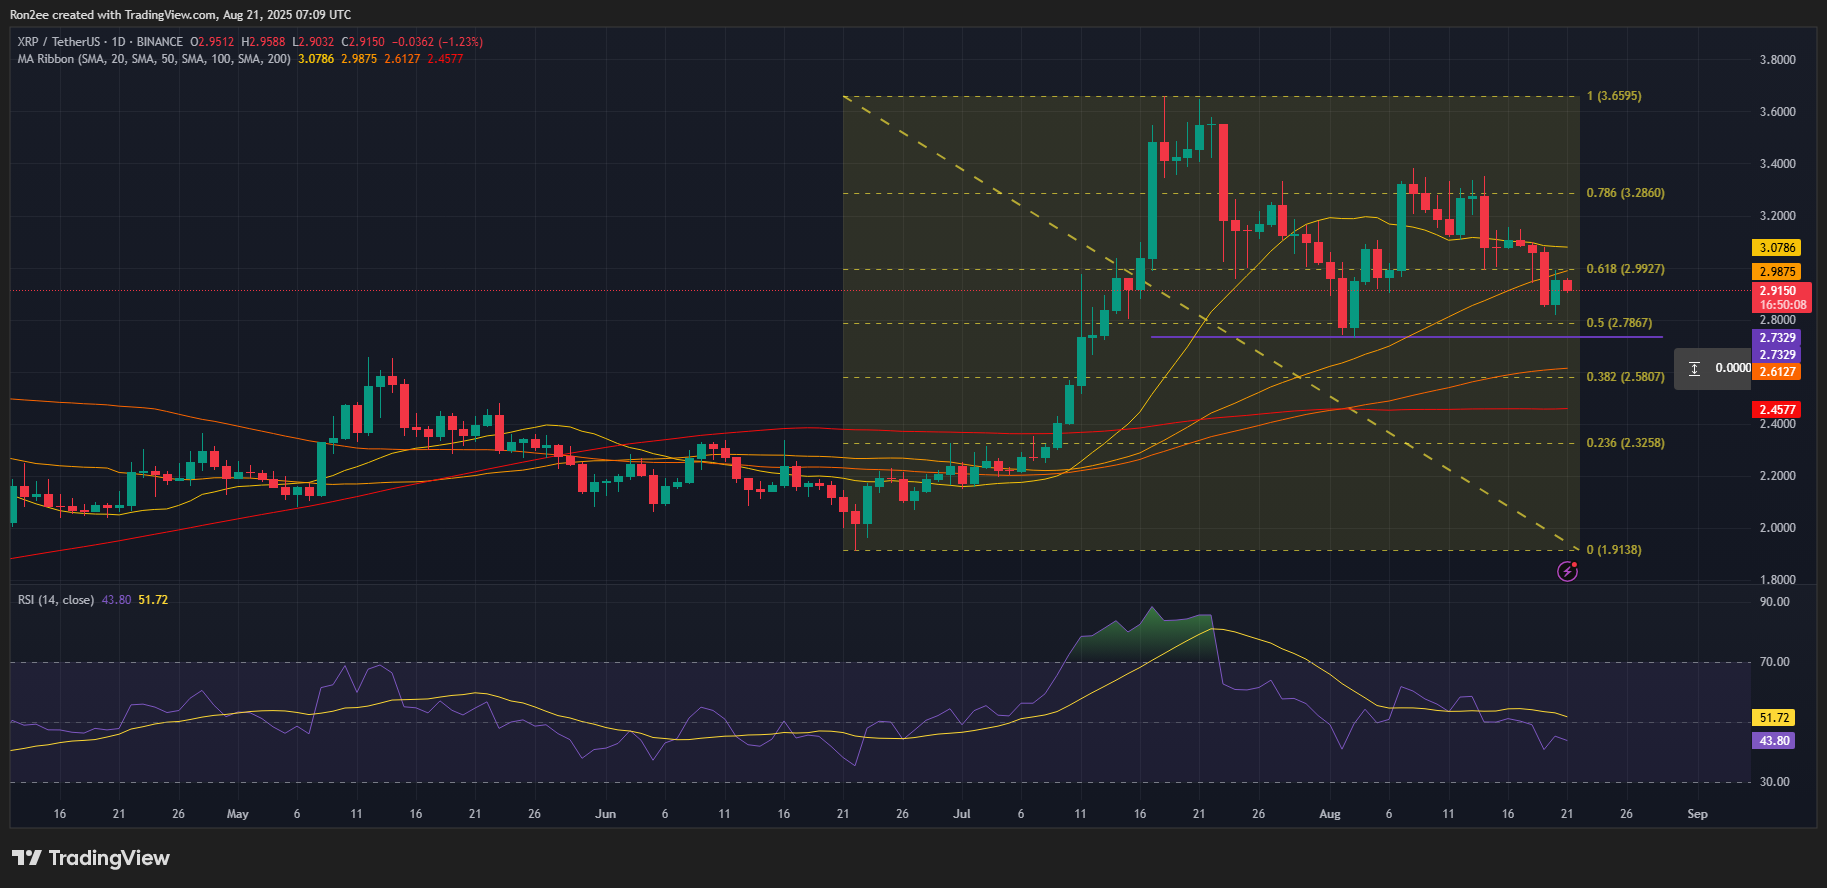
Technical indicators support the bearish outlook. The Relative Strength Index shows a bearish divergence with price action, typically signaling weakness in the prevailing uptrend. The Aroon Down indicator stands at 92.86% while Aroon Up remains at 7.14%, reinforcing the strength of the bearish trend.
The XRP/BTC pair also displays concerning signals. A bearish divergence emerged between July 10 and August 18, where the pair formed higher lows while the RSI descended from overbought conditions at 75 to 43.

Network Activity Shows Weakness
The XRP Ledger has experienced declining network activity compared to earlier periods in 2025. Daily active addresses dropped from 608,000 on March 19 to around 33,000 currently, representing a dramatic decrease in user engagement.

Weekly transactions on the XRP Ledger fell 14.8% to 12.4 million, while weekly active addresses decreased 2.1% to 107,340. Transaction counts have declined 51% from 2.5 million in June to 1.25 million currently.
This reduction in network activity typically correlates with price stagnation as lower transaction volume reduces liquidity and buying momentum. Investors view the slowdown as a sign of weakening network demand.
Spot taker cumulative volume delta data reveals intensifying sell-side activity since July 28. The negative reading indicates profit-taking among traders, signaling waning demand as sellers maintain control of the market.
With more than 91% of XRP supply still in profit at current prices, investors may continue taking gains. The token faces potential correction toward $2.70, which previously acted as key support during August’s decline.
A decisive break below $2.70 could open the path for further decline toward $2.30, coinciding with the 23.6% Fibonacci retracement level. Current technical indicators and network data suggest XRP may continue facing headwinds in the near term.


