


 Price: Last Chance to Buy the Dip Before New All-Time Highs?")


TLDR
- Bitcoin faces key resistance around $117,000-$118,000 with potential breakout needed to confirm bull run continuation
- Critical support zone identified between $111,000-$113,000 where 5.5% of Bitcoin supply has accumulated recently
- Mid-sized “Shark” wallets added nearly 1 million BTC since July while larger whale wallets distributed 715,000 BTC
- Technical indicators like RSI reclaiming 50 level and miner accumulation patterns support bullish outlook
- Analysts view current price levels as potentially the last major discount before new all-time highs
Bitcoin has shown resilience in September with a nearly 6% rally, defying its typical bearish seasonal patterns. The leading cryptocurrency now faces a critical juncture around the $117,000-$118,000 resistance zone.
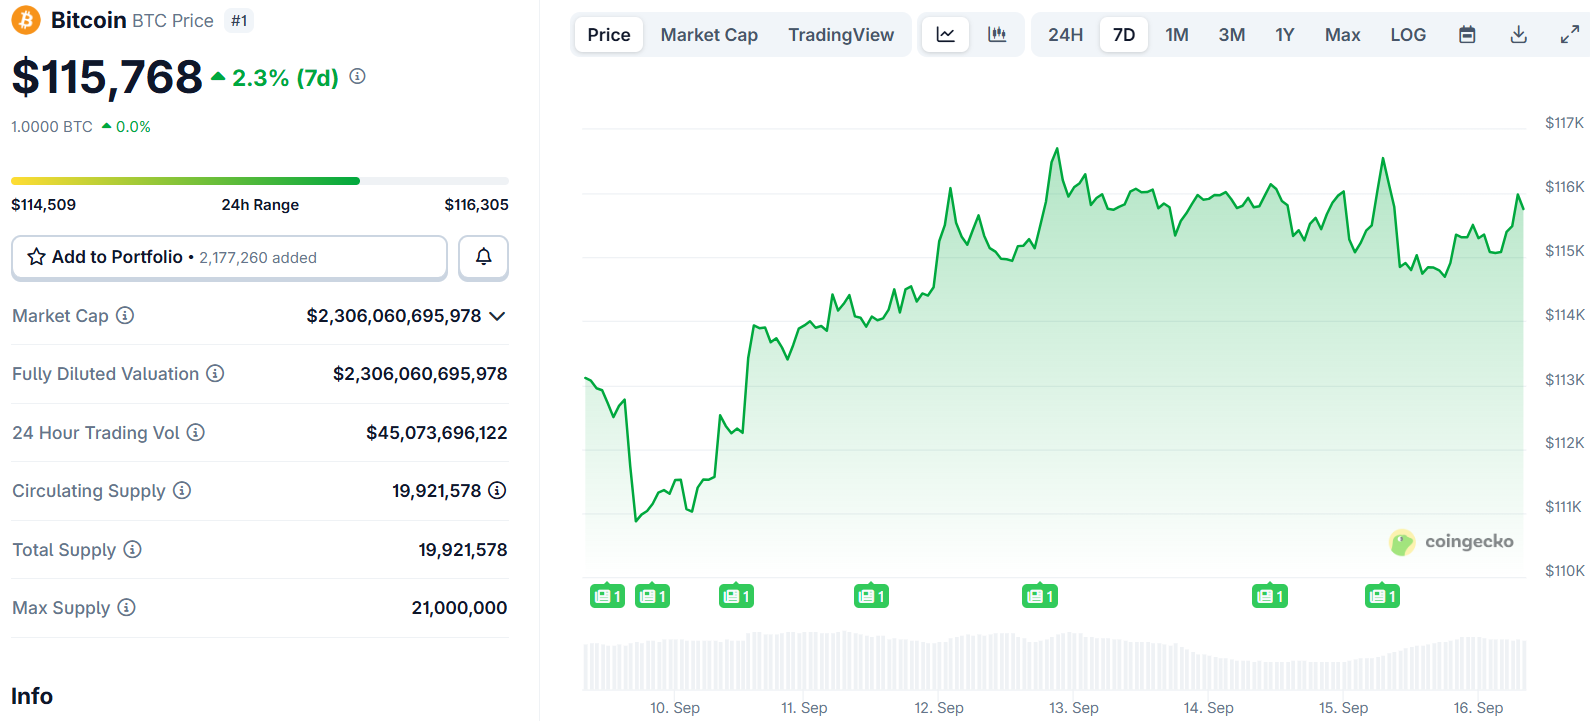
Trading at approximately $115,905, Bitcoin has been consolidating after reaching supply levels between $115,600 and $117,300. The price action over the weekend has been choppy, raising questions about whether the bull run can resume.
Multiple technical indicators point to $117,000 as a pivotal level. Two key on-chain metrics, the CVDD Channel and the Fibonacci-Adjusted Market Mean Price, have identified this zone as an area of strong interest and potential indecision.
The CVDD Channel estimates historical price floors and risk zones using coin destruction data and Fibonacci envelopes. The Fibonacci-Adjusted Market Mean Price combines market mean price with Fibonacci bands to identify structural expansion zones.
Crypto analyst Joao Wedson from Alphractal notes that both indicators have shown “eerily accurate levels” throughout Bitcoin’s price history. He believes a sustained breakout above $118,000 would confirm the resumption of bullish momentum.
💥 $117K in BTC is a Critical Zone!
Two fantastic on-chain metrics show that any price above $117K enters a zone of strong interest and indecision — historically a point where the market tends to slow down or form local tops.
Ideal Strategy?
Wait for a clear breakout — for… pic.twitter.com/4FDMQwlNfP— Joao Wedson (@joao_wedson) September 13, 2025
From a technical perspective, the critical retest zone sits between $111,000 and $113,000. This level mirrors patterns observed in the second quarter when Bitcoin rallied from sub-$100,000 levels to $109,000.


Support Zone Shows Strong Accumulation
The $113,000 zone has emerged as technical support based on UTXO realized price distribution data. This metric shows that 5.5% of Bitcoin’s supply has been accumulated between $110,000 and $113,000.

The accumulation represents one of the most actively traded ranges in recent weeks. A substantial base of holders has positioned themselves in this price band, suggesting conviction about long-term value.
The relative strength index has reclaimed the 50 level and is now testing it as support. Historically, this setup has preceded renewed buying momentum, particularly as witnessed in June’s price action.
Miner behavior is also supporting the constructive outlook. Analyst ShayanBTC notes that the combination of technical structure shift and miner accumulation provides a positive framework as long as $112,000 holds.
Wallet Distribution Patterns Shift
Since July 2024, mid-sized “Shark” wallets holding 100-1,000 BTC have added nearly 1 million Bitcoin. Their collective balance has increased to 5.939 million BTC, signaling fresh institutional and retail participation.
Meanwhile, larger whale wallets holding 1,000-10,000 BTC have reduced holdings by 324,000 BTC since March 2024. Humpback wallets with 10,000 or more BTC cut their balance by 391,000 BTC.
In total, approximately 715,000 BTC have been released into the market since last year’s peaks. This supply has been absorbed primarily by smaller, newer participants.
Bitcoin researcher Axel Adler Jr highlights this structural shift in holder composition. The distribution from whales to smaller wallets represents a healthy rebalancing of ownership.
Since March 2024, Whales (1–10K) have reduced their balance by 324K to 3.564M BTC, while Humpbacks (≥10K) decreased by 391K to 1.556M BTC.
In total, since the 2024 peaks −715K BTC has been distributed from large players' addresses and the market has been absorbing this supply… pic.twitter.com/vie5RLsLLM
— Axel 💎🙌 Adler Jr (@AxelAdlerJr) September 15, 2025
The current price action follows a familiar pattern. In June, Bitcoin consolidated below $110,000 resistance after an initial rejection, then absorbed liquidity near $105,000 before breaking out to fresh highs above $120,000 in July.
If the pattern repeats, Bitcoin should maintain the $111,000-$113,000 range to keep the uptrend intact. A deviation below this level would weaken the bullish case.
The upcoming Federal Open Market Committee meeting and expectations of interest rate cuts add another layer of market dynamics. Bitcoin experienced a mild correction on Monday, dipping below $114,500 ahead of the Wednesday meeting.
Analysts view this dip as potentially presenting a favorable buying opportunity. The combination of technical support levels and fundamental accumulation patterns suggests the current zone could represent one of the last meaningful discounts before renewed upside.


