


TLDR
- Aster (ASTER) dropped nearly 15% in 24 hours, making it the worst performer among top 100 cryptocurrencies on Wednesday
- Top traders including TraderSZ and Yazan opened long positions, with TraderSZ targeting $2.50, $3.00, and $3.50
- Binance data shows elite traders hold nearly three times more long positions than shorts, with a ratio of 2.80
- Whale holders offloaded nearly 8 million ASTER tokens worth approximately $12 million over the past week
- Technical analysis shows ASTER completed an ABC correction at the 0.618 Fibonacci level, suggesting a potential bullish reversal
Aster suffered one of the biggest drops in the cryptocurrency market on Wednesday. The token fell nearly 15% over 24 hours.
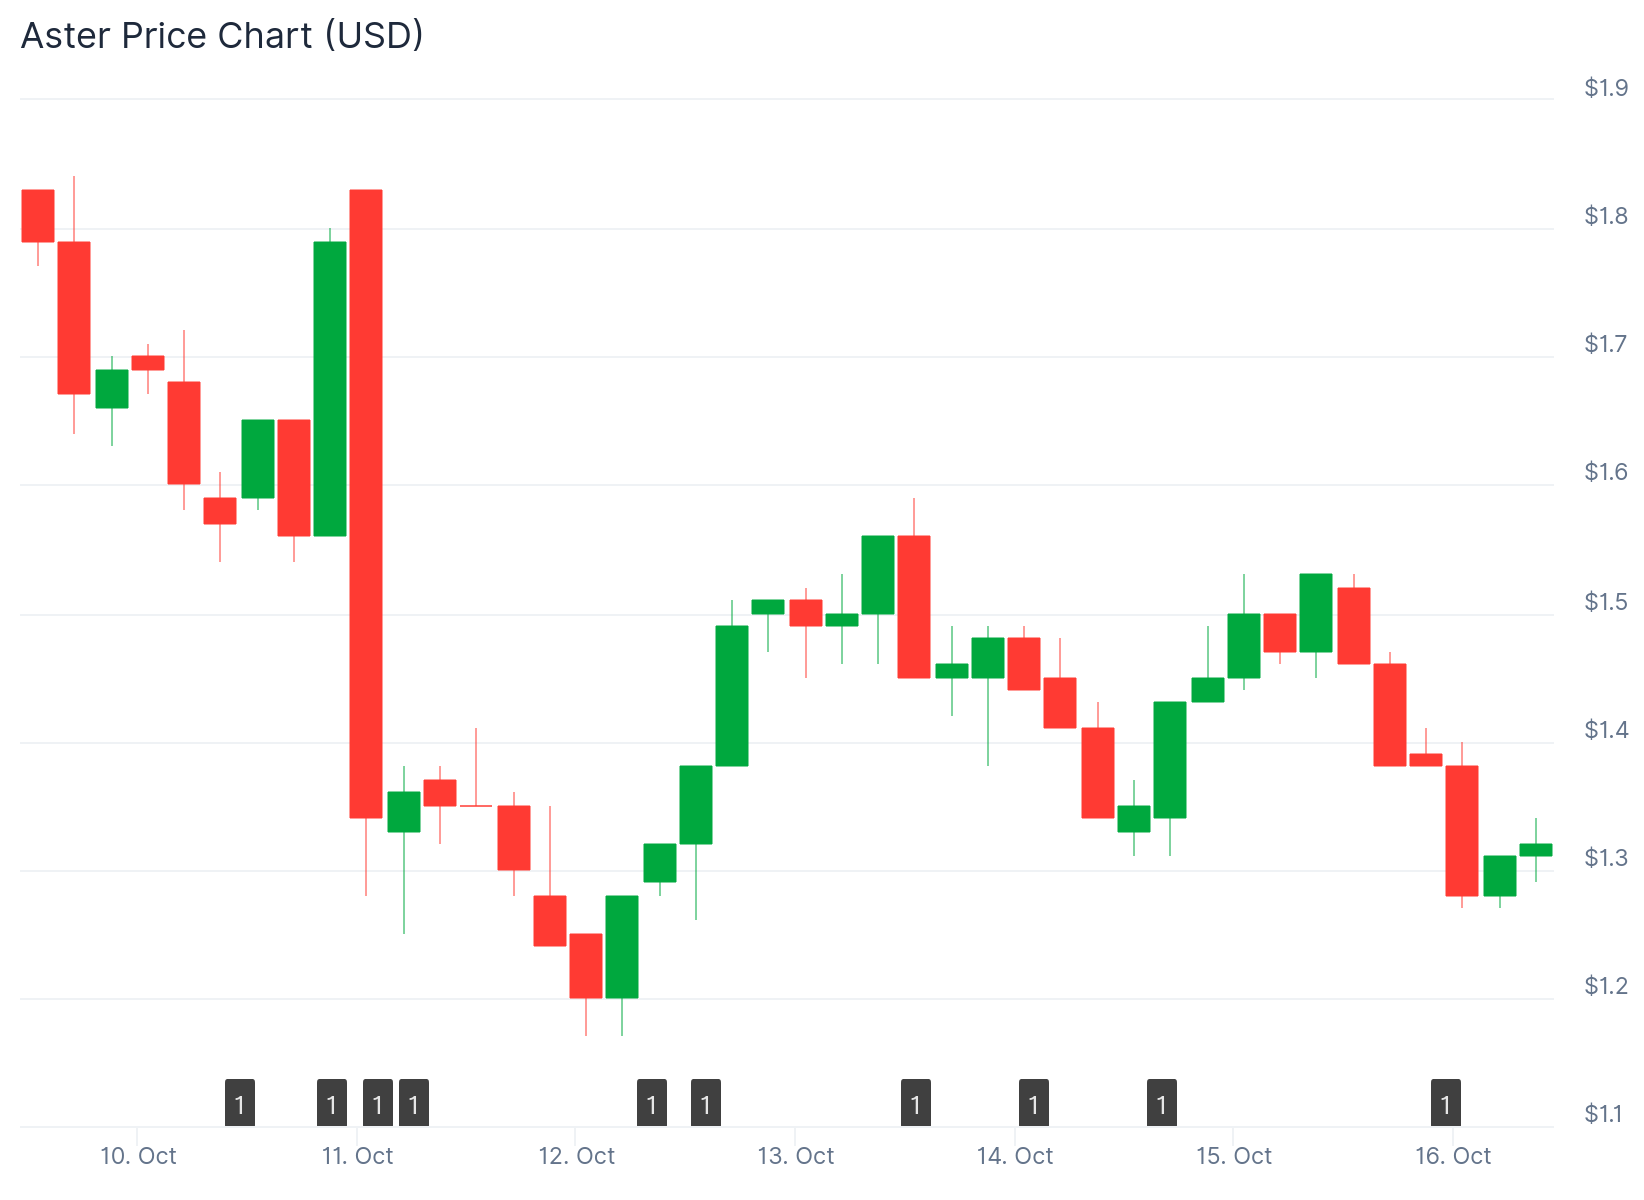
This made ASTER the worst performer among the top 100 cryptocurrencies listed on CoinMarketCap. The broader crypto market also saw red across most assets.
im swing long $ASTER again
will move stops to breakeven if we reclaims mid range pic.twitter.com/z170pVHfbU
— TraderSZ (@trader1sz) October 15, 2025
Despite the sharp decline, several prominent traders are now taking bullish positions. TraderSZ, a well-known crypto trader and influencer, announced a swing long position on ASTER.
His targets include $2.50, $3.00, and $3.50. He set a stop-loss at $0.99 to manage downside risk.
TraderSZ is not alone in his bullish stance. Trader Yazan closed his short position on ASTER and opened a leveraged long instead.
Onchain Lens also reported a $7.65 million spot purchase on Binance. This large buy order suggests institutional interest despite the price drop.

Binance Data Shows Strong Bullish Sentiment
Futures data from Coinglass reveals interesting positioning among professional traders. On Binance, the Top Trader Long/Short ratio for ASTER/USDT currently stands at 2.80.
This means elite traders hold nearly three times more long positions than short positions. The data suggests professional accounts remain confident in an upward move.
. $aster looking great on daily now.
kind of funny because ppl didnt shut the fuck up about it like 2 weeks ago and now we got the nice abc on daily and perfect wick into the 0.618 and nobody wants it anymore. https://t.co/sMulHlRhel pic.twitter.com/yDQEKvv3R8
— Bluntz (@Bluntz_Capital) October 14, 2025
Trader Bluntz provided detailed analysis explaining his optimism. He noted that ASTER completed a clean ABC correction pattern.
The token also wicked perfectly into the 0.618 Fibonacci retracement level. In Elliott Wave theory, an ABC correction marks the end of a pullback within a larger bullish trend.
The C wave typically ends near the 0.618 Fibonacci level. This is where buyers usually return to the market.
A bounce from this zone often signals the corrective phase is over. Bluntz suggests the recent dip was a standard correction rather than a trend reversal.
Technical Patterns Point to Potential Bottom
The 4-hour chart shows an M-shaped structure forming. This could develop into a double bottom pattern, which is a classic bullish reversal signal.
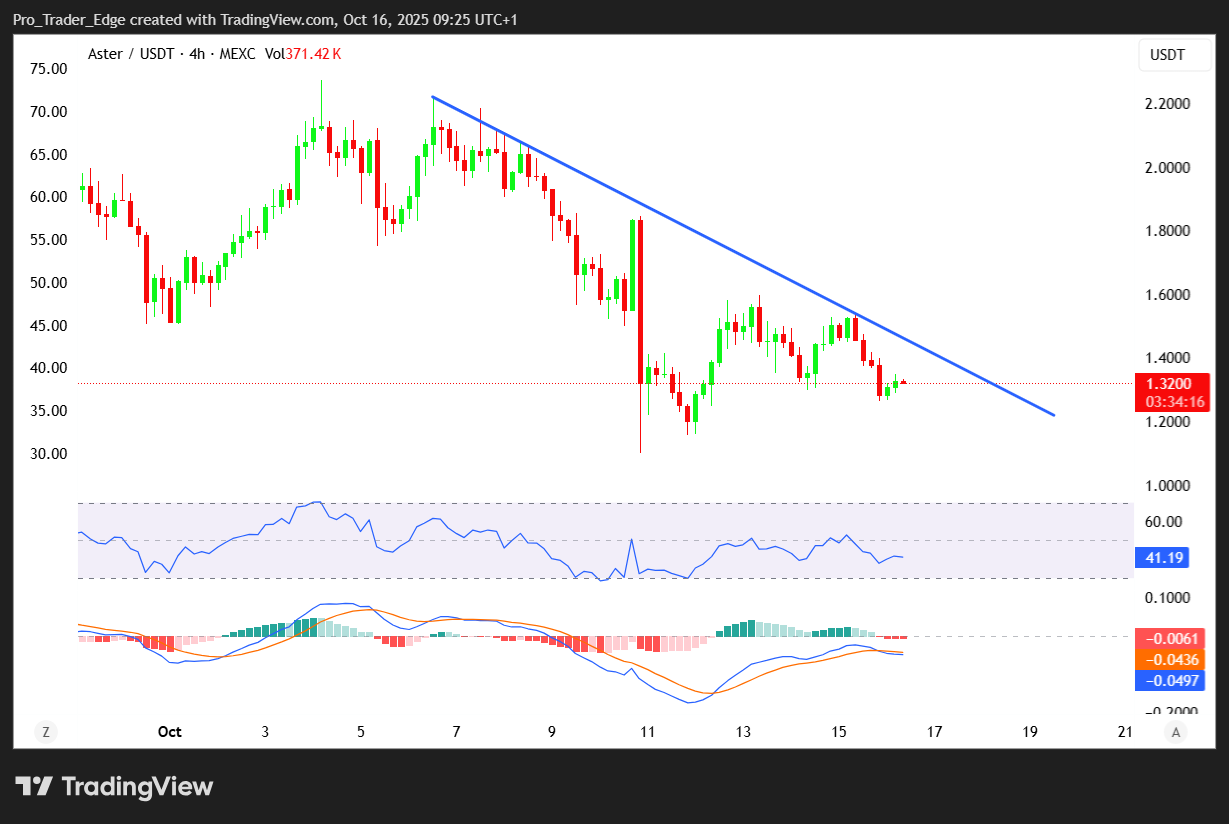
If the price retests the $1.15 zone and holds, it may confirm the double bottom. This would indicate a potential rebound is coming.
A move above the $1.32 resistance level would provide another buy signal. This would suggest bulls are regaining control of the market.
Whale Activity Raises Questions
While traders open long positions, whale activity tells a different story. Holders with more than 10 million ASTER sold nearly 20% of their holdings over the past week.
This amounts to roughly 8.05 million tokens worth about $12.07 million. Smart money addresses also reduced their holdings by approximately 5%.
Exchange balances increased by 12.32 million tokens in the last 24 hours. Rising exchange reserves often indicate tokens being prepared for sale.
The Money Flow Index continues making lower lows. This shows retail traders are not buying the dip yet.
ASTER trades inside a descending triangle on the 4-hour chart. The token must close above $1.59 to invalidate the bearish setup.
A break above this level could open paths to $1.72 and $2.02. The Relative Strength Index shows a hidden bearish divergence pattern.


