


 Price: Could This Golden Cross Pattern Trigger Another Major Rally?")


TLDR
- Bitcoin is retesting the golden cross pattern, which previously led to gains of 2,200% in 2017 and 1,190% in 2020
- Analysts say Bitcoin needs to hold above $110,000 to avoid signaling the end of the current cycle
- The 4-hour Money Flow Index shows Bitcoin is deeply oversold, suggesting a potential short-term bounce
- President Trump announced 100% tariffs on Chinese imports starting November 1, which contributed to market volatility
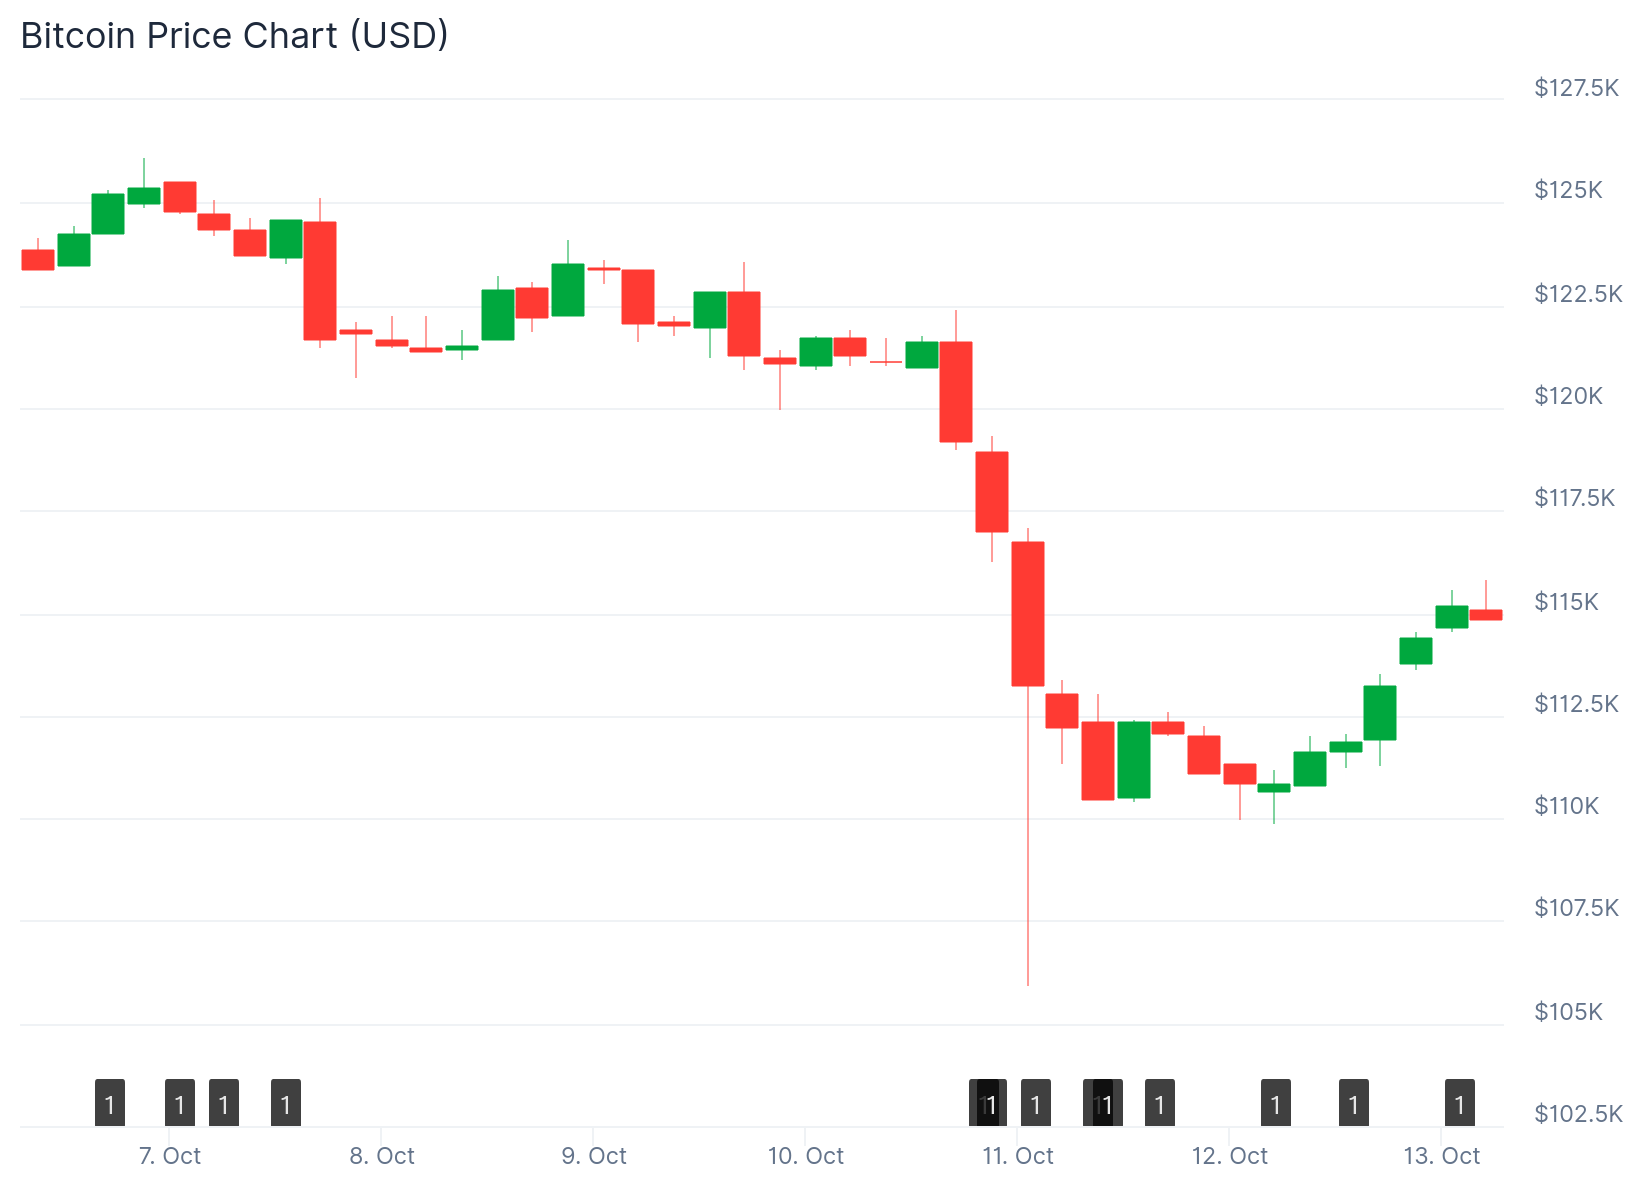
- Bitcoin recovered above $113,500 after dipping below $110,000 but faces resistance near $116,000
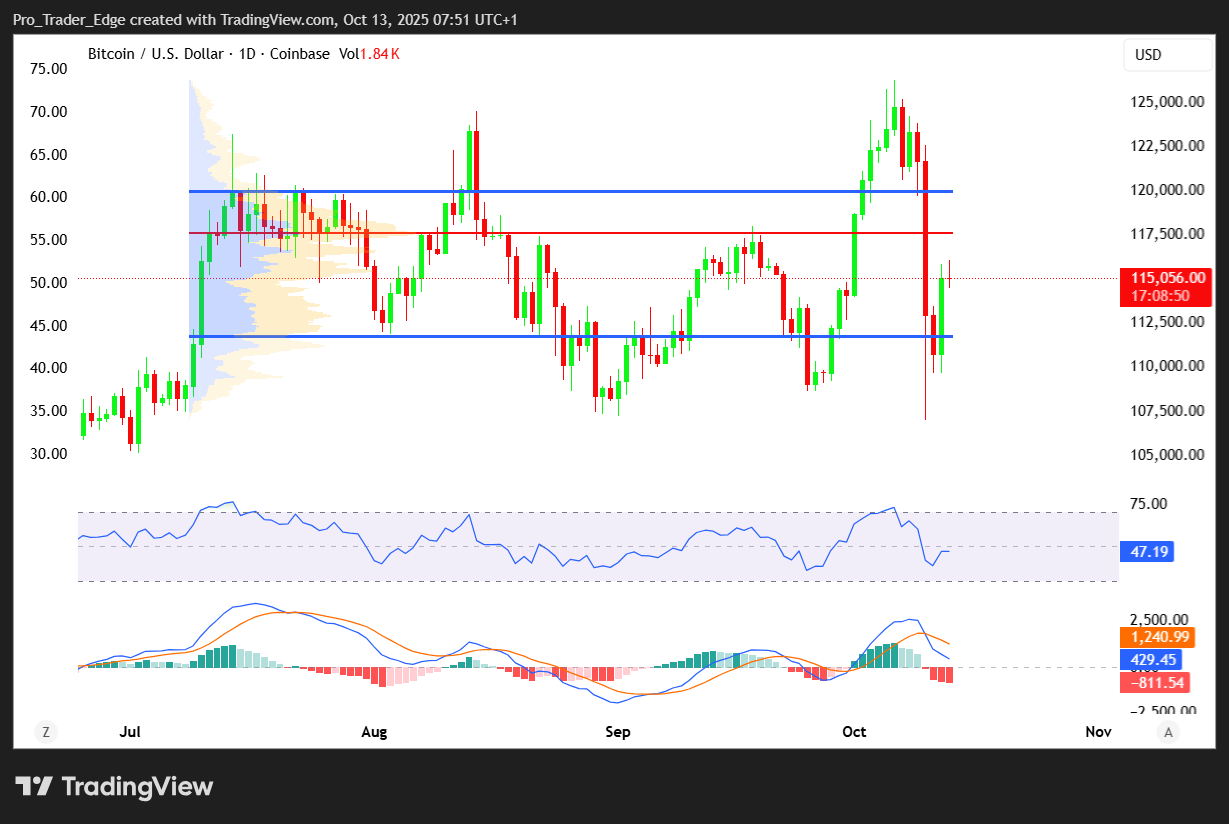
Bitcoin is currently retesting a bullish technical pattern called the golden cross. This pattern appears when the 50-day moving average crosses above the 200-day moving average.
The golden cross has historically marked the start of major price rallies for Bitcoin. In 2017, this pattern preceded a 2,200% gain. In 2020, it led to a 1,190% increase.
Bitcoin is trading near $110,000 right now. Crypto analyst Mister Crypto says holding above this level could trigger another strong upward move. He described the current setup as incredibly strong.
Bitcoin is retesting the golden cross right now.
If we can hold above, $BTC price will absolutely explode! pic.twitter.com/VAQqsEfRGe
— Mister Crypto (@misterrcrypto) October 12, 2025
A confirmed breakout above this level could push Bitcoin’s price much higher in the coming weeks. The analyst believes the technical conditions are favorable for continued growth.
However, other analysts warn that Bitcoin must maintain the $110,000 level. Crypto analyst Mac said falling below this price could signal the end of the current market cycle.
Key Technical Levels and Recovery Attempts
Mac pointed out that the 4-hour Money Flow Index is deeply oversold. This indicator suggests Bitcoin could bounce back in the short term. He expects some upward movement next week but not a major surge.

Bitcoin recently recovered from a drop below $110,000. The price climbed back above $113,500 after this dip.
The recovery faces several obstacles. Bitcoin is currently trading below $116,000 and the 100-hour simple moving average. A bearish trend line is forming with resistance at $119,500.
The immediate resistance sits near $116,000. The first major resistance level is at $116,250. If Bitcoin breaks above $118,000, it could test $119,500 next.
Market Volatility and External Factors
The recent market pullback affected both stocks and crypto. Fundstrat co-founder Tom Lee noted that markets had risen 36% since April. Friday’s drop was the biggest decline in six months.
The VIX volatility index spiked by 1.29%. This was the 51st largest spike in the VIX ever recorded. Lee said this type of volatility spike typically signals a short-term market bottom.
President Trump announced new tariffs on Chinese imports. The US will impose 100% tariffs on all Chinese goods starting November 1. This decision came after China introduced new export restrictions on rare earth minerals.
China controls about 70% of global rare earth supply. The country now requires an export license for any product containing more than 0.1% Chinese-sourced rare earths. These rules take effect December 1.
If Bitcoin fails to hold above $116,000, it could face another decline. The first major support level is at $113,500. Below that, support sits at $112,500 and $110,500.


