


 Price: Drops Below $66,000 as U.S.-Israel Strikes on Iran Rattle Markets")


TLDR
- Bitcoin dropped to ~$63,000 over the weekend after U.S.-Israel strikes on Iran before recovering to ~$67,000
- Reports of Iran’s Supreme Leader being killed briefly pushed BTC above $68,000
- Crude oil surged up to 13%, keeping pressure on risk assets including Bitcoin
- U.S. economic data this week, including Friday’s jobs report, could move Bitcoin further
- A bear pennant pattern on the daily chart points to a potential drop toward $52,000
Bitcoin fell sharply over the weekend as joint U.S. and Israeli military strikes on Iran triggered a broad sell-off across global markets.
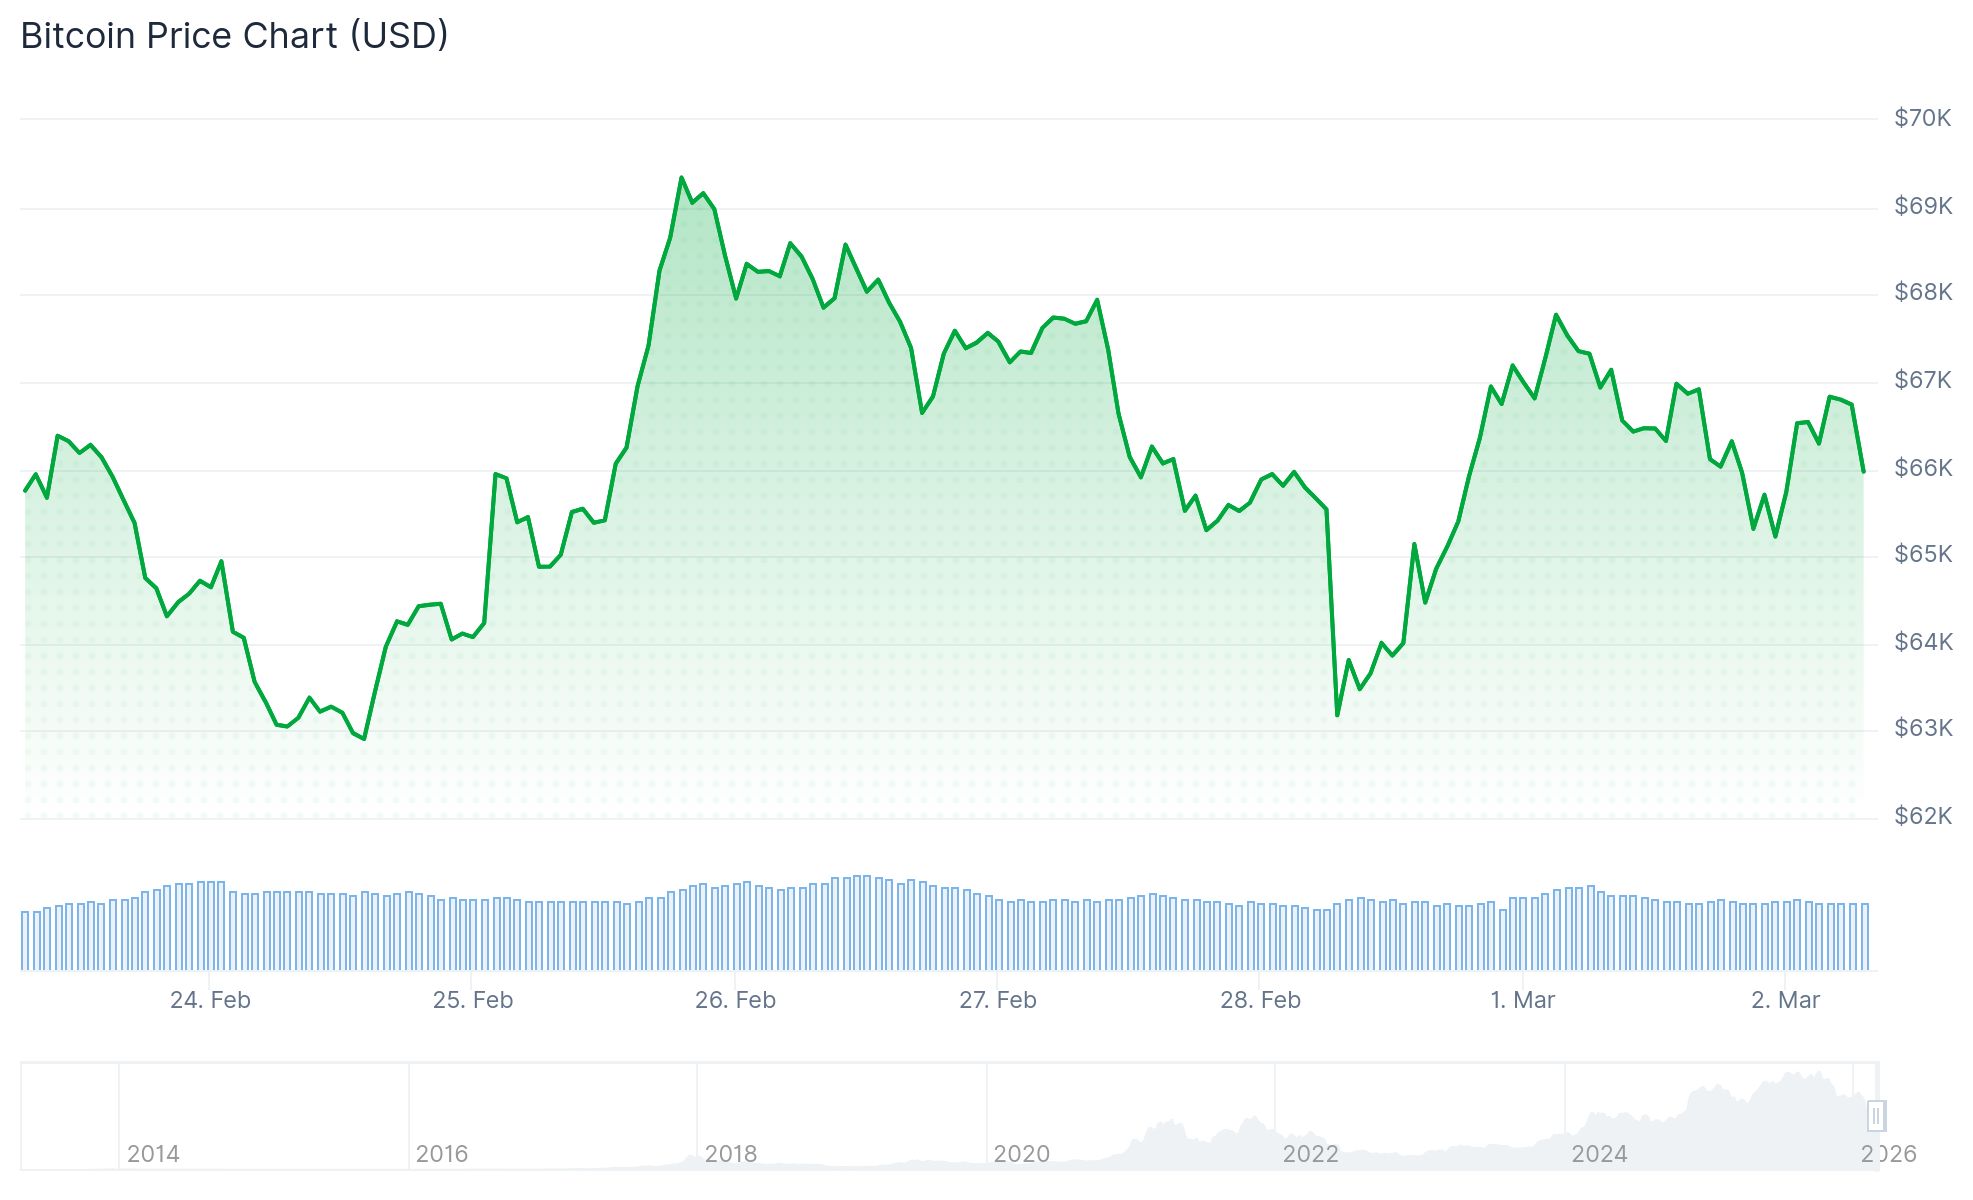
The world’s largest cryptocurrency dropped to around $63,255 on Saturday, a roughly 6.5% decline, before recovering to reclaim the $67,000 level by Monday.
By early Monday morning, BTC was trading at around $66,197, down about 2.1% on the day.
Feb 2022: Russia attacked Ukraine.
▫️ $BTC dumped first and then rallied 40%.
June 2025: Israel attacked Iran.
▫️ Bitcoin dumped first and then rallied 25%.
Feb 2026: US attacked Iran.
Will a similar pattern follow again? pic.twitter.com/b8FLF4aR9p
— Ted (@TedPillows) February 28, 2026
The strikes included the reported killing of Iranian Supreme Leader Ayatollah Ali Khamenei — news that briefly pushed Bitcoin above $68,000 before the move faded.
Iran responded with multiple waves of missile strikes targeting U.S. and Israeli military installations. President Trump said the campaign would continue as long as necessary.
$BTC price action is pretty simple lately.
We're waiting for a resolution of this rectangle.
Break above $71.8k = bullish; relief rally in store.
Break below $62.6k = bearish; $60k or lower in store.One interesting thing: BTC pumped yesterday on the war news re: Iran.… pic.twitter.com/AQTkznNx0r
— 𝙲𝚘𝚕𝚒𝚗 𝚃𝚊𝚕𝚔𝚜 𝙲𝚛𝚢𝚙𝚝𝚘 🪙 (@ColinTCrypto) March 1, 2026

Ethereum fell roughly 10% in the wake of the attacks, trading near $1,950 on Sunday.
Oil and Safe-Haven Assets Surge
Crude oil markets reacted sharply to the conflict. Brent crude jumped as much as 13% and West Texas Intermediate rose nearly 10% on Sunday night.
Gold climbed around 2%, reaching multi-week highs as investors moved into safe-haven assets.
Sean Farrell, head of digital assets at Fundstrat, said geopolitical sell-offs are typically buyable, but flagged crude oil as the key risk variable. He warned that any disruption to shipping lanes or energy flows could weigh further on Bitcoin.
U.S. stock futures also fell during Asian trading hours, pointing to a weaker Wall Street open.
Key U.S. Data and Chart Levels Ahead
Bitcoin traders are now watching a packed U.S. economic calendar. The ISM Manufacturing report lands Monday, followed by ADP payrolls and ISM Services on Wednesday.
The main event is Friday’s Nonfarm Payrolls report, which frequently moves Treasury yields and the dollar — both of which can impact Bitcoin’s price.
$BTC FEB CLOSED AT $67K. EVEN WITH THE US STRIKE ON IRAN.
IS THIS FRACTAL MANIFESTING IN FULL? pic.twitter.com/0LQ0dGvx4G
— Crypto Seth (@seth_fin) March 1, 2026
On the charts, BTC is forming what analysts describe as a bear pennant after its drop from the $73,000–$74,000 area. The pattern suggests the asset may stay range-bound between $63,000 and $69,000 in the near term.
A breakdown from that range could target the $51,800–$52,000 support zone, according to technical projections.
Bitcoin is down 23% year-to-date and has posted five straight months of losses. It peaked at an all-time high of $126,000 in October.
Some Wall Street analysts now see a scenario where BTC falls toward $50,000 before any potential recovery in the second half of the year.
As of Monday, BTC was last trading around $65,961.


